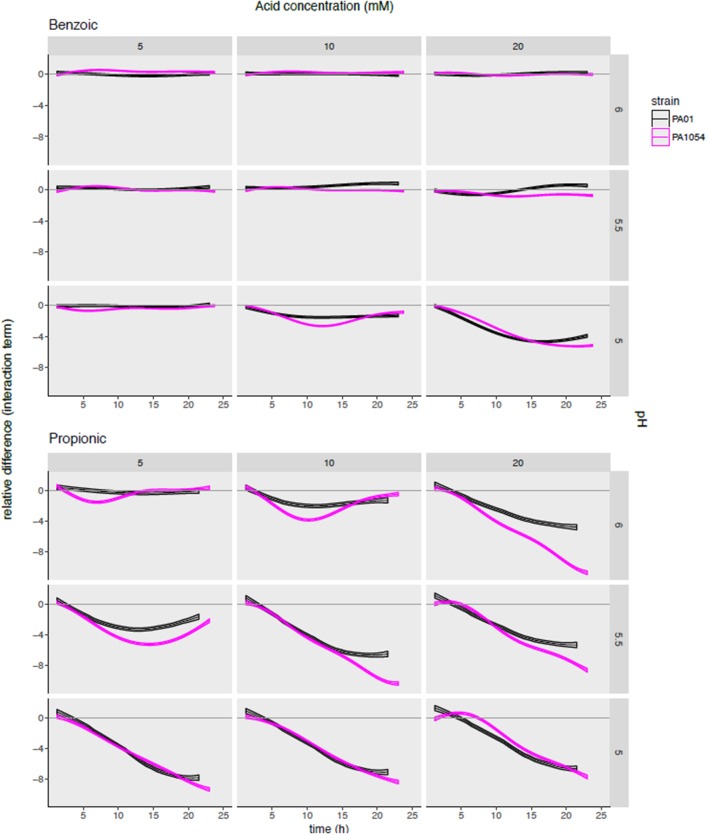
Figure 7.
Modeling the combinatorial effects of OA/pH together relative to either pH or OA treatment alone pinpoints effective conditions specific for inhibiting growth of each strain. Each subgraph in the grid plots the posterior predictions of the interaction term functions across each OA/pH combination and strain. Each curve represents the function mean (center line of each curve) and standard deviation (width of curve) for phenom interaction term function. Time in hours (0–25) is given on the X-axis, and the difference in log2 normalized growth compared to either pH or OA independently [i.e., independent effect of pH, αp(t); and independent effect of OA, βm(t)] is given on the Y-axis. Individual axis numbers are not shown for clarity of the figure, but each sub-graph shown has the same axis ranges. OA concentrations are arranged across the columns of the graph grid, and pH levels down the rows. Black lines represent growth of PAO1 strain, magenta represents PA1054. Results from only two OA types (most highly active and most weakly active) are shown for clarity, with the results from the remaining acids shown in Figure S4.

