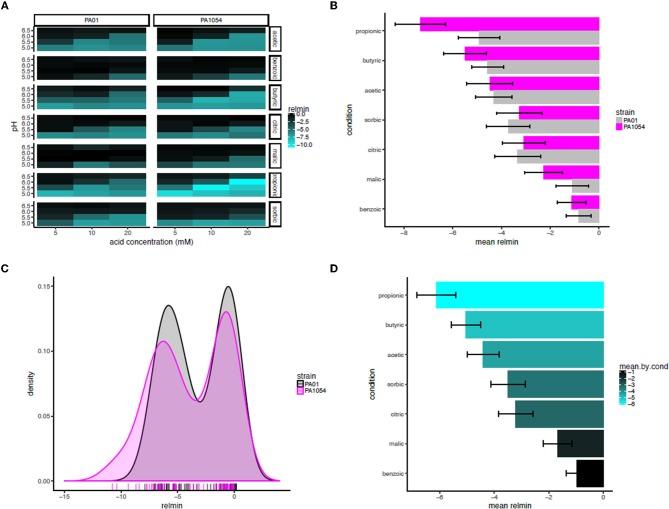
Figure 8.
Propionic acid in combination with low pH is the most effective antimicrobial treatment for both strains. (A) Heat map of mean minimum relative difference (interaction term) estimates from the phenom model. In each heatmap subpanel, OA concentrations are shown on the X-axis and pH levels on the Y-axis. In the heatmap grid, PAO1 strain is given in the left column and PA1054 in the right. OA type is given in the rows, abbreviated as follows: ac., acetic; ben., benzoic; bu., butyric; cit., citric; mal., malic; prop., propionic; sor., sorbic. Brighter cyan intensity indicates a lower minimum interaction term estimate (see color legend at far right). (B) Bar graph rank ordering OA types in terms of mean relative minimum in each strain. OA types with the greatest bacteriostatic effect are shown at top, the ones with the least effect on the bottom. Gray bars, PAO1; magenta bars, PA1054. (C) Density histograms of minimum interaction terms for cultures of PAO1 and PA1054 at growth limiting concentrations of OA and pH levels. Ticks in rug plot represent individual carrying capacity values. (D) Bar graph rank ordering and quantifying mean of relmin for each OA across strains and OA types. Brighter cyan intensity indicates a lower minimum interaction term estimate (see color legend at far right).

