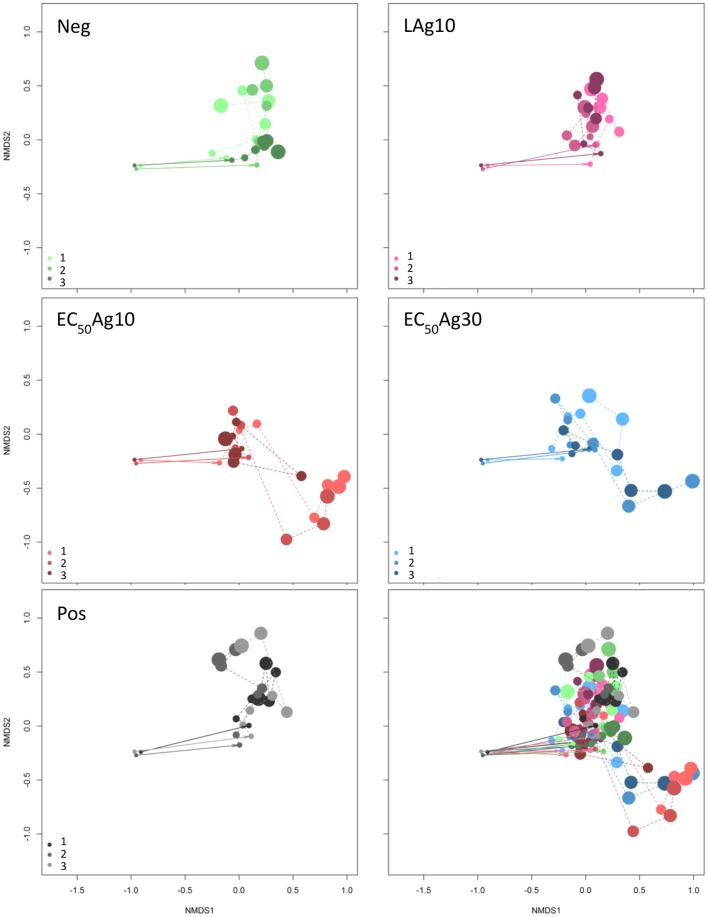
Figure 1.
Dynamic cytometric structure changes of microbial communities. Data are shown for Setup 1 for silver ion negative control (Neg), 0.1 mg/L AgNP-10 (LAg10), 2.25 mg/L AgNP-10 (EC50Ag10), 7.13 mg/L AgNP-30 (EC50Ag30), silver ion positive control of 0.25 mg/L AgNO3 (Pos) (Bray-Curtis dissimilarity, stress: 0.12). Three parallel experiments were performed and shown in light, middle, and dark colors: green for Neg, pink for LAg10, red for EC50Ag10, blue for EC50Ag30, gray for Pos. The cytometric microbial community of each sampling day is shown as a dot and the dot size increases with increasing sampling time from 0 to 24 d. All five conditions are shown together in the sub-figure at the bottom-right. Comparable data for Setup 2 are shown in Figure S3.

