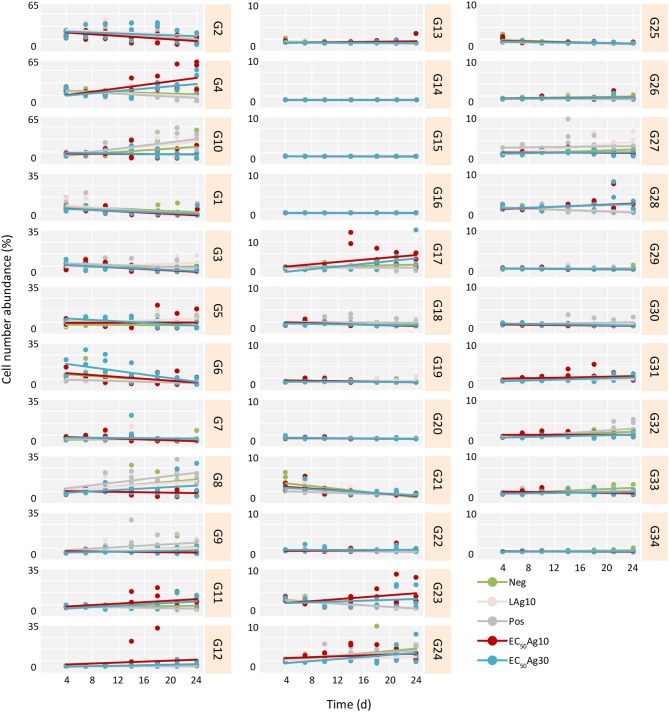
Figure 2.
Trends in cell number increase or decrease per treatment and gate from 4 to 24 d for Setup 1 (inoculum of 0 d is excluded). The trends are estimated for all treatments and their respective triplicates: silver ion negative control (Neg), 0.1 mg/L AgNP-10 (LAg10), silver ion positive control of 0.25 mg/L AgNO3 (Pos), 2.25 mg/L AgNP-10 (EC50Ag10), and 7.13 mg/L AgNP-30 (EC50Ag30). The slope (k) of each trend is given in Table S3.

