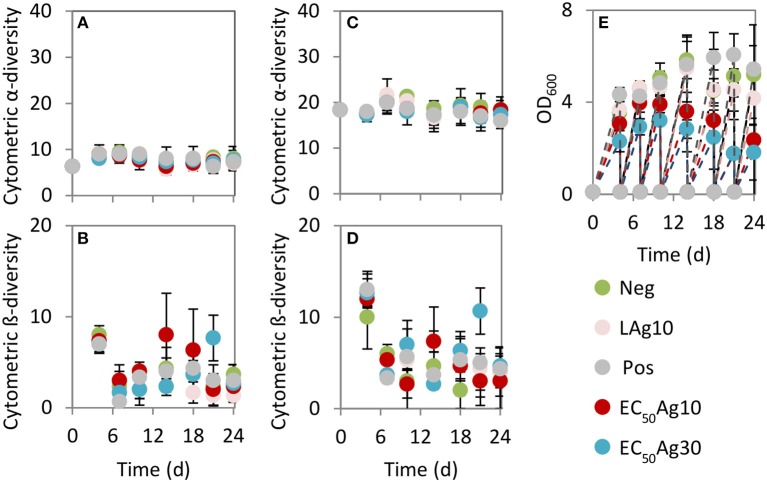
Figure 3.
Cytometric diversity metrics (A–D) and biomass production (E). Data are shown for Setup 1 for silver ion negative control (Neg), 0.1 mg/L AgNP-10 (LAg10), 2.25 mg/L AgNP-10 (EC50Ag10), 7.13 mg/L AgNP-30 (EC50Ag30), silver ion positive control of 0.25 mg/L AgNO3 (Pos). (A) Cytometric α-diversity values (threshold of 2.9%), (B) Cytometric intra-community β-diversity values (threshold of 2.9%), (C) Cytometric α-diversity values (at lower threshold of 0.71%), (D) Cytometric intra-community β-diversity values (at lower threshold of 0.71%). Error bars are sample standard deviations from three parallel experiments. Comparable data for Setup 2 are shown in Figure S4.

