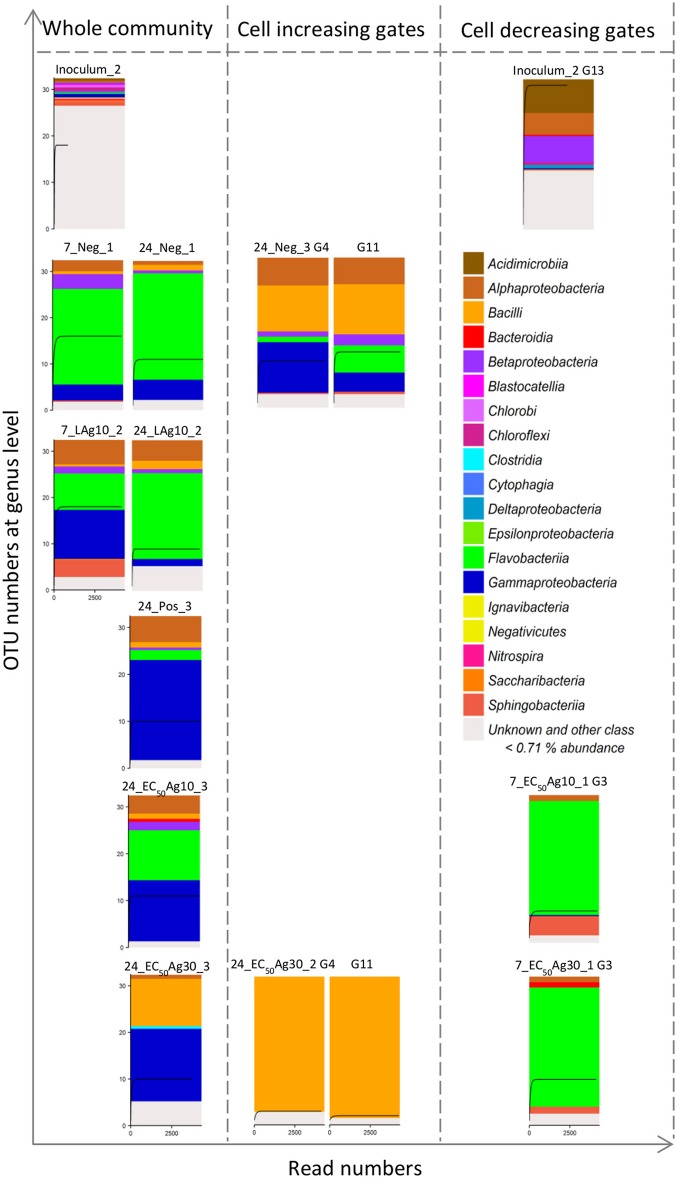
Figure 4.
16S rRNA gene amplicon sequencing of 15 samples including 8 whole community samples and 7 sorted subcommunities. Data are shown for Setup 1. The 8 whole community samples included inoculum, silver ion negative control (Neg, 7 and 24 d) and 0.1 mg/L AgNP-10 (LAg10, 7 and 24 d), silver ion positive control (Pos, 24 d), 2.25 mg/L AgNP-10 (EC50Ag10, 24 d), 7.13 mg/L AgNP-30 (EC50Ag30, 24 d). The 7 sorted subcommunities included the dominant G13 in the inoculum, the positive correlating G4 and G11, and negative correlating G3 with the duration of silver exposure. Each class above a threshold of 0.71% is presented by a color. The rarefaction curve inside each histogram represents the number of genera. Details of class and relative genera list with abundances are shown in Table S5.

