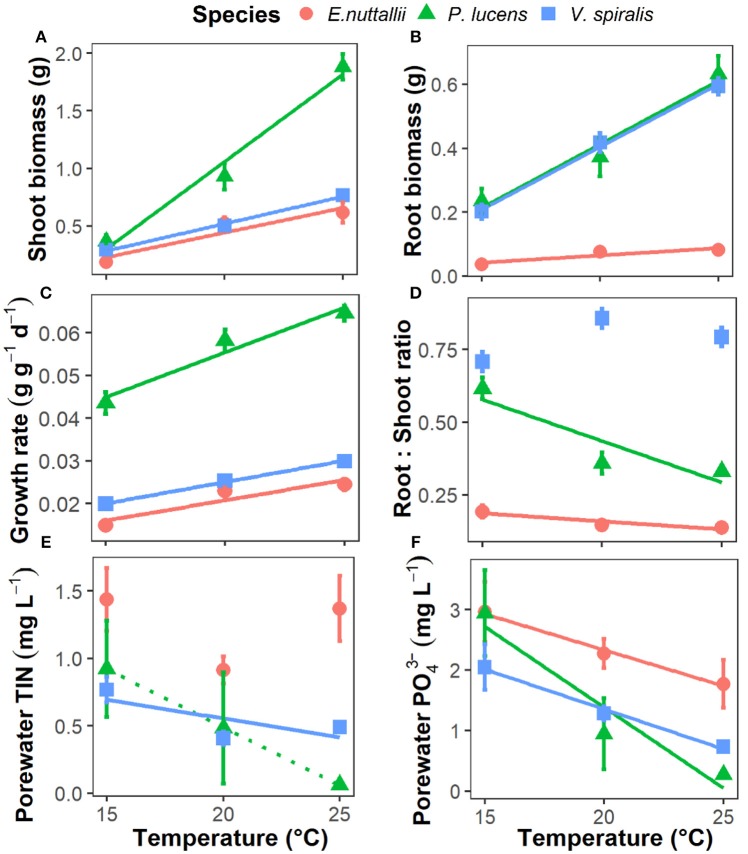
Figure 1.
Responses of aquatic plant growth parameters and available nutrients to rising temperature in the three aquatic plants. (A) plant shoot biomass, (B) plant root biomass, (C) plant relative growth rate, (D) plant root:shoot ratio, (E) sediment pore water total dissolved inorganic nitrogen concentrations (TIN), and (F) sediment pore water dissolved inorganic P-PO. Point with bar represents mean ± SE (n = 15 for points of growth parameters and n = 5 for points of pore water nutrient concentrations). Temperature effects on the parameters of each species are indicated by regression lines. A solid line indicates p < 0.05, a dotted line indicates 0.05 < p < 0.1, and without line indicates p > 0.1.

