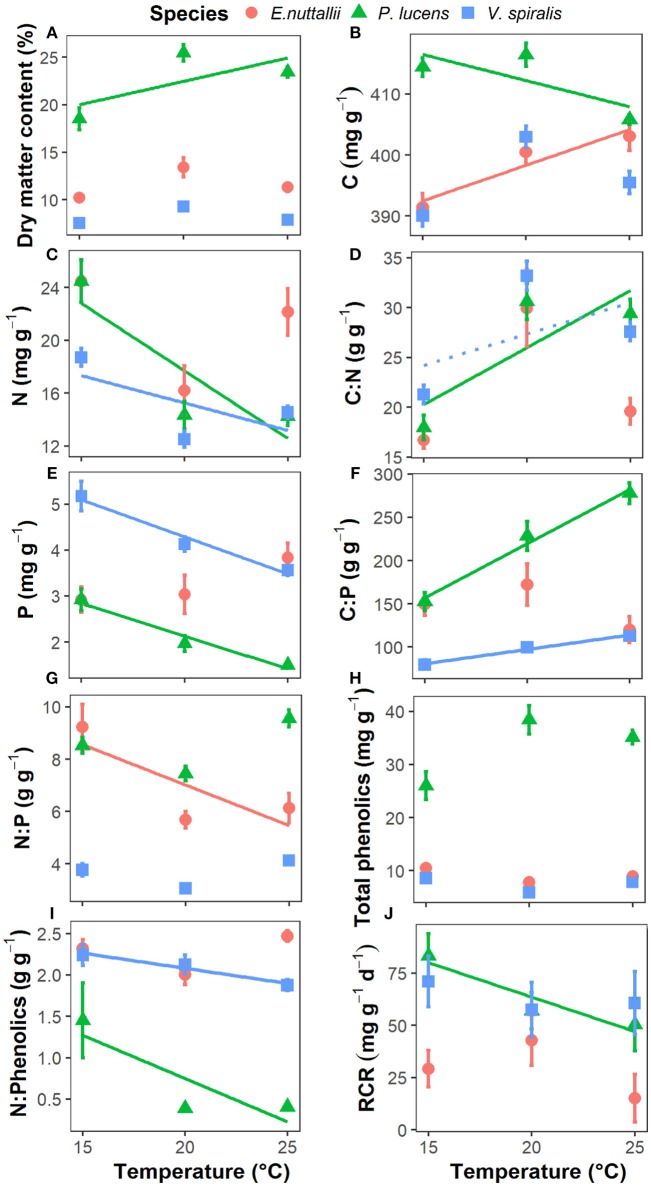
Figure 2.
Response of aquatic plant traits and palatability to rising temperature in the three aquatic plants. (A) plant dry matter content, (B) plant C content, (C) plant N content, (D) plant C:N ratio, (E) plant P content, (F) plant C:P ratio, (G) plant N:P ratio, (H) plant total phenolics concentration, (I) plant N:Phenolics ratio, and (J) plant palatability indicates plant relative consumption rate, RCR. Point with bar represents mean ± SE (n = 15 for each point). Temperature effects on the parameters of each species are indicated by regression lines. A solid line indicates p < 0.05, a dotted line indicates 0.05 < p < 0.1, and without line indicates p > 0.1.

