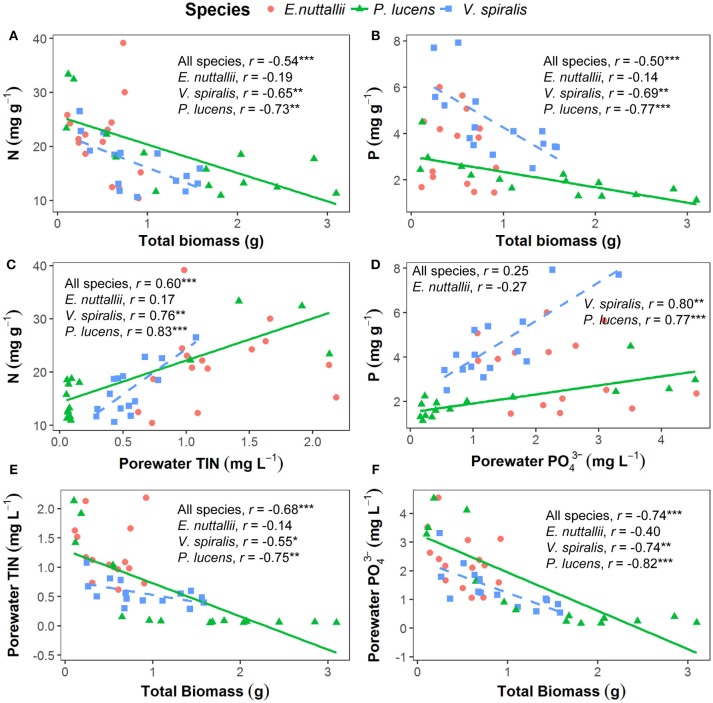
Figure 3.
Pearson's correlations of plant total biomass, plant nutrient contents and porewater nutrient concentrations for the three tested species. Each species has 15 data points from every temperature treatment, in total 45 points for each panel. Lines in the graph indicate that factors are significantly correlated at the species level (p < 0.05). (A) N content in the plants in relation to the total plant biomass. (B) P content in the plants in relation to the total plant biomass. (C) N content in the plants in relation to the total inorganic nitrogen concentration in the porewater. (D) P content in the plants in relation to the phosphorous concentration in the porewater. (E) Total plant biomass in relation to the total inorganic nitrogen concentration in the porewater. (F) Total plant biomass in relation to the phosphorous concentration in the porewater. *p < 0.05, **p < 0.01, ***p < 0.001.

