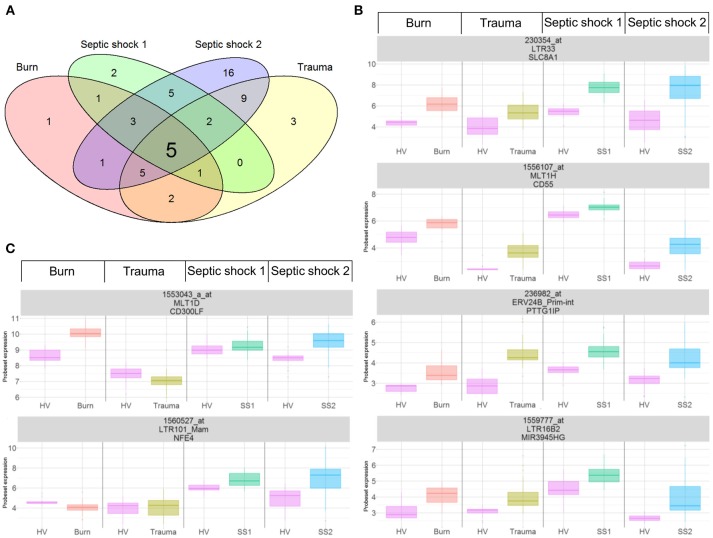
Figure 2.
Differentially expressed HERVs in severely injured patients. (A) Venn diagram of differentially expressed HERVs for each dataset. (B) Expression profiles of commonly modulated probesets targeting HERVs in the 4 datasets, at D1. (C) Expression profiles of 2 selected probesets targeting HERVs. Boxes are color-coded by cohort. For each graphic, from top to bottom, title contains: probeset name, HERV name and closest gene.

