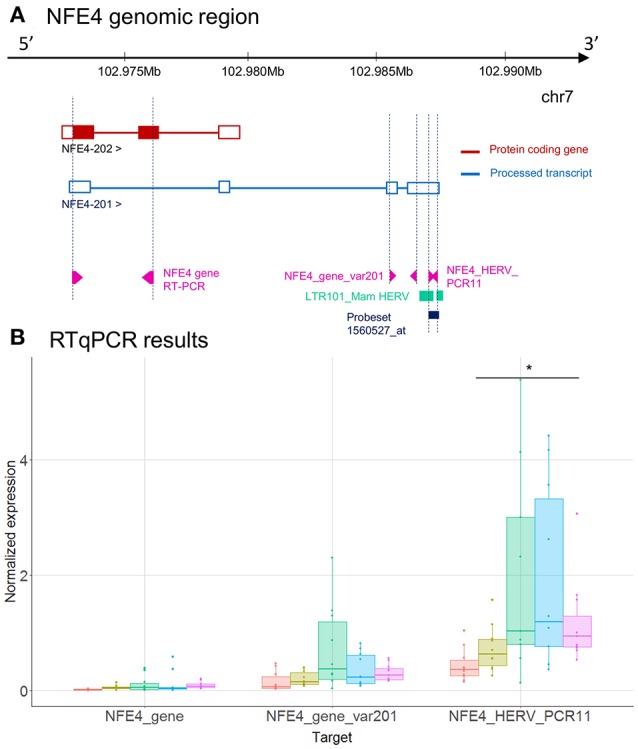
Figure 4.

LTR101_Mam HERV and NFE4 gene expression. (A) NFE4 genomic region, with the position of HERV in green, of probeset in dark blue, of PCR designs in purple. (B) Expression levels of specific transcripts by RT-qPCR, as described in A, in HV and patients at D1. Expression levels (copy number / μl) were normalized with reference gene (HPRT1). Boxes are color-coded by cohort. Statistically significant difference with HV is marked by * (Wilcoxon signed rank test, p < 0.05).
