Figure 6.
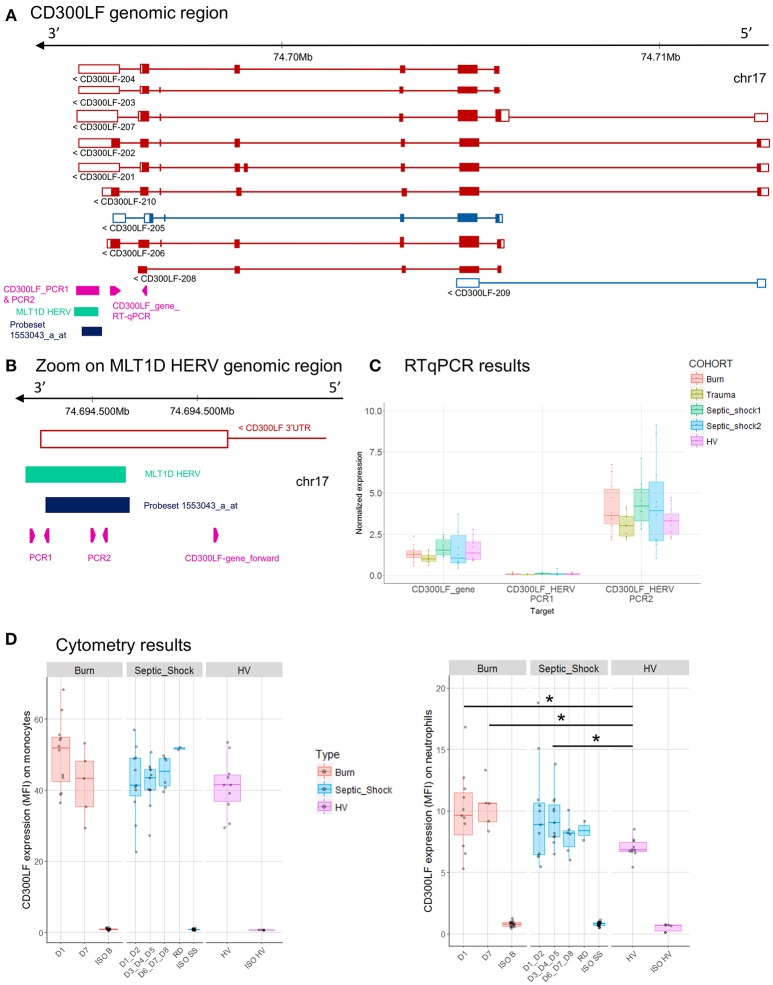
CD300LF associated HERV. (A) CD300LF genomic region, with the positions of HERV in green, of probeset in dark blue, of PCR designs in purple. (B) Zoom in genomic region of HERV showing PCR designs in detail. (C) Expression levels of specific transcripts by RT-qPCR, as described in A and B, in HV and patients at D1. Expression levels (copy number/μl) were normalized with reference gene (HPRT1). Boxes are color-coded by cohort. (D) Protein expression levels (MFI), on monocytes (left), and neutrophils (right) from 14 burn patients (red), 11 septic shock patients (blue), and 10 HV (purple). Columns ISO B, ISO SS, and ISO HV correspond to isotypes for burn, septic shock, and HV, respectively. Statistically significant difference with HV is marked by * (Wilcoxon signed rank test, p < 0.05).

