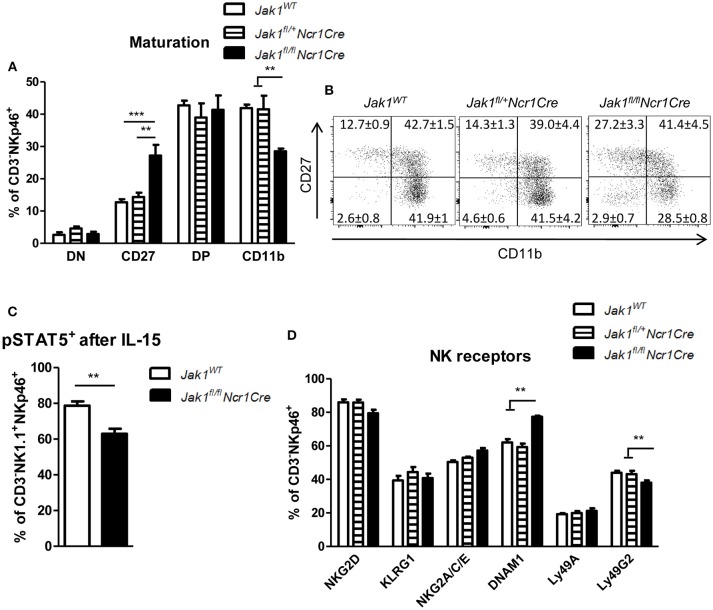
Figure 2.
The remaining Jak1fl/flNcr1Cre NK cells show an immature phenotype. (A,B) Splenic CD3−NKp46+ NK cells were analyzed for expression of CD27 and CD11b by flow cytometry. (A) Frequency of cells in each maturation stage is shown: DN (CD27−CD11b−), CD27 (CD27+CD11b−), DP (CD27+CD11b+), CD11b (CD27−CD11b+). The total numbers of cells in each maturation stage are shown in Figure S1C. (B) Representative plots are shown. (C) pSTAT5(Y694)+ cells were analyzed within the CD3−NKp46+NK1.1+ population ex vivo after 15 min stimulation with IL-15 by flow cytometry. (D) Splenic CD3−NKp46+ NK cells were analyzed for expression of the indicated activating and inhibitory receptors by flow cytometry. The percentage of NK cells positive for each receptor is shown. The median fluorescence intensity data is presented in Figure S1D. (A–D) Bar graphs and numbers on the plots represent mean ± SEM of 2 independent experiments; n = 5–8. **p < 0.01, ***p < 0.001.

