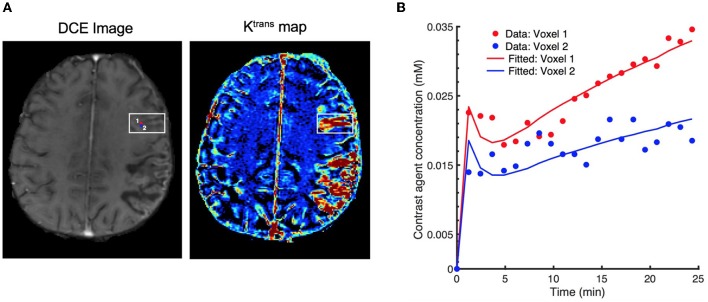
Figure 1.
Effect of signal noise on the resulting parameters with conventional fitting models. (A) an examplary DCE image (left) displaying two neighboring voxels (marked by red and blue circles) in the stroke region, and the corresponding Ktrans maps (right), (B) resulting fitted contrast agent concentration curves for these two voxels using Extended Tofts model. Although the neighboring voxels are spatially very close to each other (only 1-pixel away), the observed concentration data are different due to the excessive signal noise. Eventually, there is a substantial difference in the fitted concentration curves and parameter values (Ktrans = 6.18 × 10⁻³min−1 for voxel 1, and Ktrans = 2.48 × 10⁻³min−1 for voxel 2).

