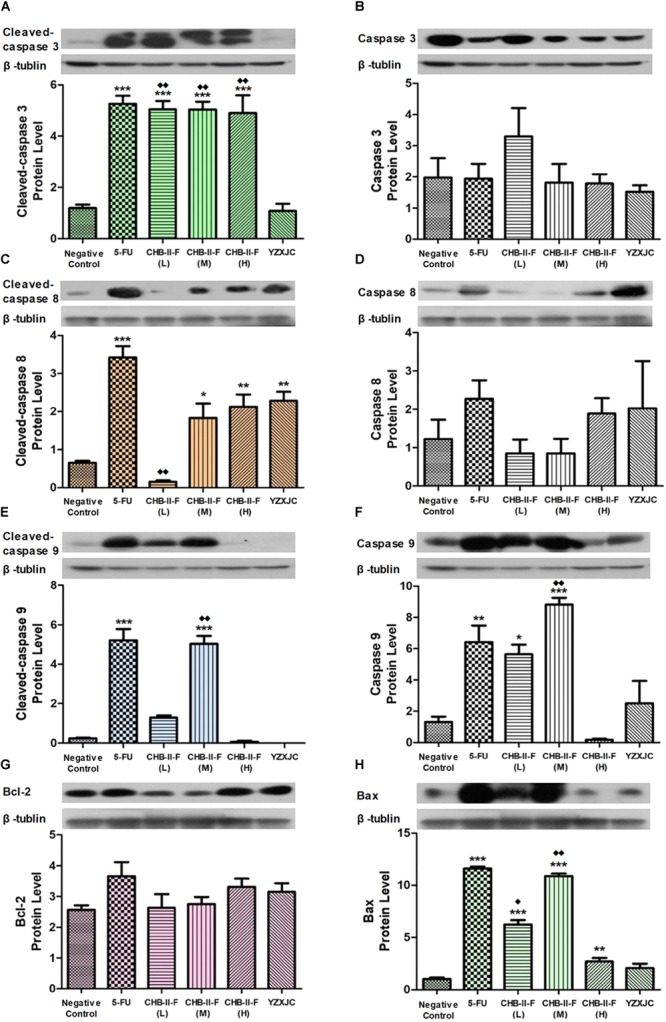
FIGURE 9.

Effects of CHB-II-F on protein expression of caspase-3, caspase-8, caspase-9, Bax and Bcl-2 in tumor tissue of the chemotherapy-treated H22 hepatocellular carcinoma mouse model. (A) Cleaved-caspase 3 protein level; (B) Caspase 3 protein level; (C) Cleaved-caspase 8 protein level; (D) Caspase 8 protein level; (E) Cleaved-caspase 9 protein level; (F) Caspase 9 protein level; (G) Bcl-2 protein level; (H) Bax protein level. Data were presented as the mean ± SD from 6 mice. Statistical analysis: ∗P < 0.05, ∗∗P < 0.01, ∗∗∗P < 0.001 compared with the saline group;  P < 0.05,
  P < 0.01 compared with the YZXJC group. (The same loading control was used for uncleaved and cleaved versions of the same protein, and for Bcl-2 and Bax for ease of comparison).
