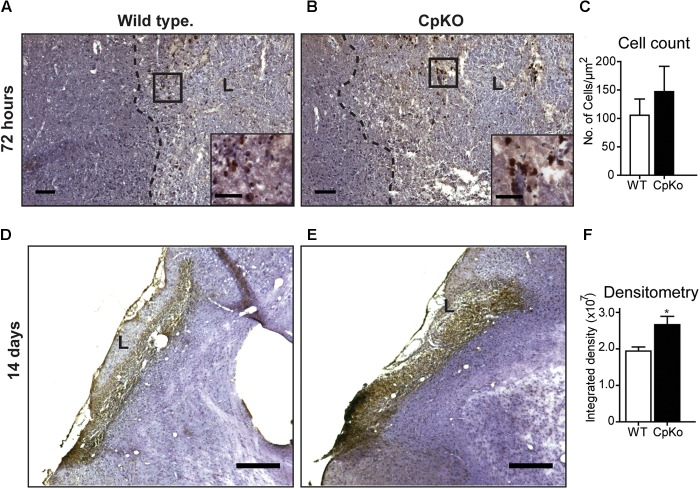
FIGURE 4.
Iron histochemistry. Detected by the enhanced Turnbull’s staining of tissue sections taken 72 h (A–C) and 14 days (D–F) after pMCAO. At 72 h the cells labeled for iron (stained dark brown; see insets in A and B) are located in the lesion and distributed along the lesion border in both wildtype (A) and CpKO (B) mice; L = lesion; areas in the black squares in A,B are shown at higher magnification in the insets. (C) Graph shows that the number of iron+ cells is not significantly different in the two genotypes. At 14 days (D,E) the iron labeled cells are densely packed in the lesion (L) making it difficult to do cell counts. Densitometric analysis (F) showed higher levels of iron deposition in CpKO mice compared to wildtype mice at 14 days. All sections counterstained with Mayer’s hemalum stain. Scale bars in A–E = 100 μm, inset = 50 μm; n = 6 per group; ∗p-value ≤ 0.05.

