FIGURE 5.
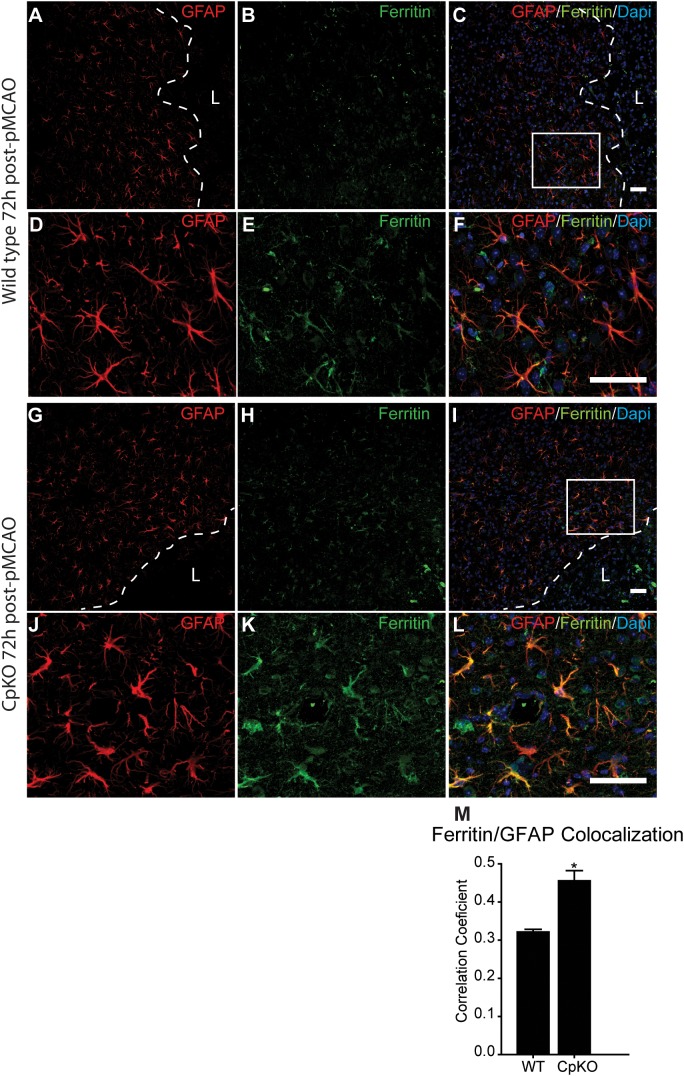
Immunofluorescence labeling for ferritin in astrocytes. Low magnification images of the border region of the infarct and the peri-infarct region in wildtype (A–C) and Cp KO (G–I) mice 72 h after pMCAO. Dotted line demarcates the lesion boundary and L marks the lesion site. The area in the white square in panels C,I are shown at higher magnification in panels D–F and J–L. Note increase in the number and intensity of the ferritin labeling in CpKO mice (K) as compared to the wildtype mice (E). The number of astrocytes that are double labeled for ferritin is higher in the Cp KO (K) than in wildtype mice (E). The merged images (C,F,I,L) show GFAP, ferritin and DAPI nuclear staining. (M) Graph showing the extent of double labeling of GFAP and ferritin estimated using Pearson’s correlation coefficient (n = 4). Scale bar = 50 μm, ∗p-value ≤ 0.05.

