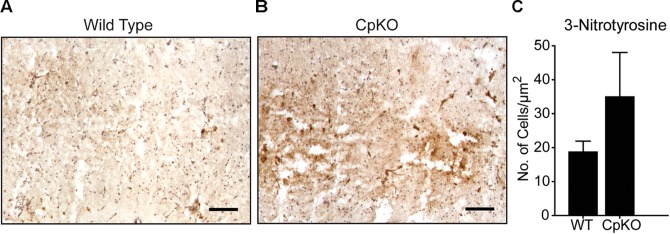
FIGURE 8.
Changes in protein oxidation detected by 3-nitrotyrosine labeling. Tissue sections of wildtype (A) and CpKO (B) mice showing immunohistochemical staining for 3-NT. The 3-NT staining is seen as a brown reaction product. (C) Graph shows that the number of 3-NT+ cells shows a trend to be higher in CpKO compared to wildtype mice but does not reach statistical significance. The tissue sections were counterstained with Mayer’s hemalum which labels the cell nuclei blue. n = 4; scale bar = 100 μm.

