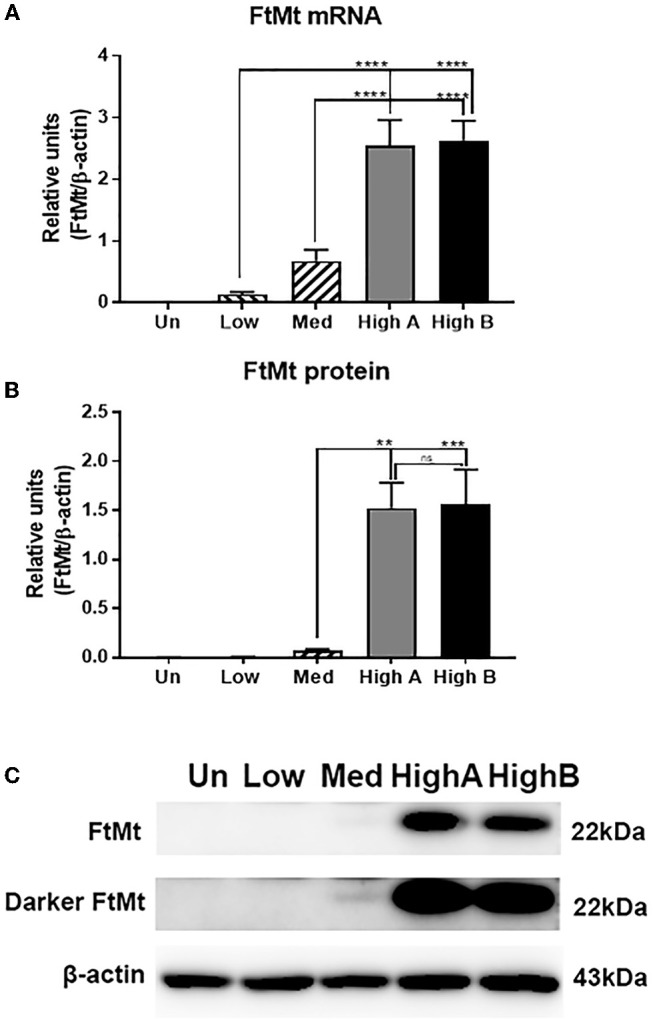
Figure 1.

(A) FtMt mRNA expression in FtMt expressing clones and untransfected differentiated SH-SY5Y cells: Real time PCR results showing comparison of FtMt mRNA levels in indicated clones compared to untransfected cells normalized for levels of β-actin mRNA. Results show combination of triplicate independent experiments with 2 or 3 samples/experiment. Data analyzed by One-way ANOVA with Tukey's post-hoc comparison test. Bar charts illustrate mean ± standard error of mean (SEM). Results with p-values of significance are indicated. *p < 0.05; **p < 0.01, ***p < 0.001, ****p < 0.0001. (B) FtMt protein expression in FtMt expressing clones and untransfected differentiated SH-SY5Y cells: Western blot results showing comparison of FtMt protein levels in indicated clones compared to untransfected cells normalized for levels of β-actin protein. Results show combination of triplicate independent experiments with 2 or 3 samples/experiment. Data analyzed by One-way ANOVA with Tukey's post-hoc comparison test. Bar charts illustrate mean ± SEM. Results with p-values of significance are indicated. *p < 0.05; **p < 0.01, ***p < 0.001, ****p < 0.0001. (C) Representative Western blots of FtMt expressing clones and untransfected differentiated SH-SY5Y cells: Representative western blot image of data shown in (C). FtMt expression was highly expressed in clones High A and High B. A longer exposure was required to show FtMt protein in Medium (Med) expressing clone (Darker FtMt).
