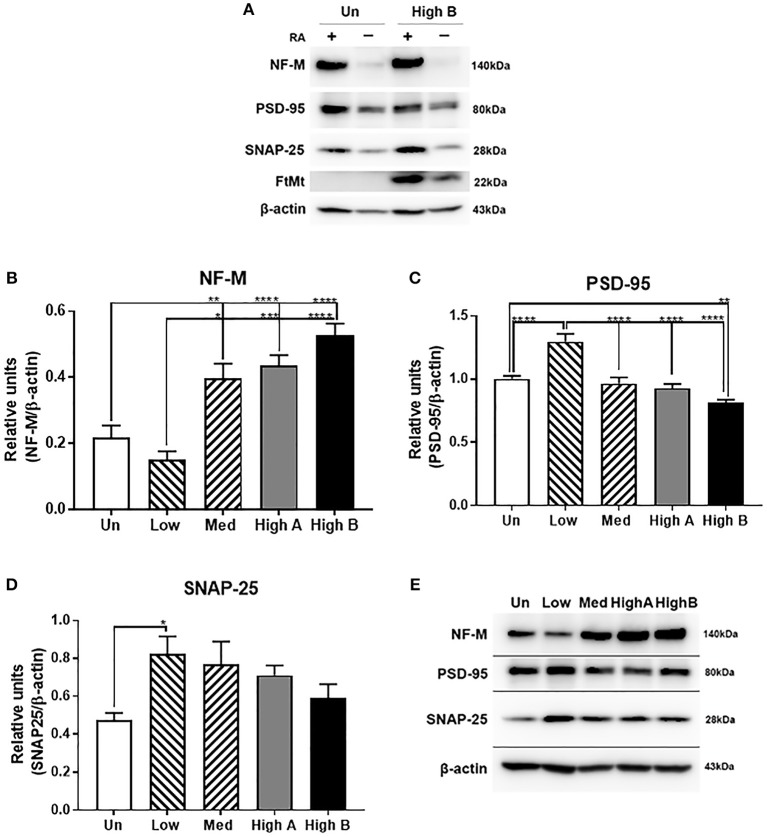
Figure 4.
Expression of neuronal proteins in FtMt clones. (A) Composite picture of western blots showing the differences in levels of NF-M, PSD-95, SNAP-25, and FtMt between undifferentiated (-) and RA differentiated (+) of untransfected (Un) and FtMt high expressing clone (High B). It was noticed in all experiments that FtMt expression was increased with differentiation RA treatment, even though the expression vector was using the CMV immediate-early promoter, and not the native FtMt promoter. (B) Relative levels of NF-M (B) in different FtMt clones. Results shown in B represent mean ± SEM of triplicate experiments. Data analyzed by One way ANOVA with Tukey's post hoc test of significance. Results indicate level of significance. *p < 0.05; **p < 0.01, ***p < 0.001, ****p < 0.0001. (C) Relative levels of PSD-95 (C) in different FtMt clones. Results shown in C represent mean ± SEM of triplicate experiments. Data analyzed by One way ANOVA with Tukey's post-hoc test of significance. Results indicate level of significance. *p < 0.05; **p < 0.01, ***p < 0.001, ****p < 0.0001. (D) Relative levels of SNAP-25 (D) expression in different FtMt clones. Results shown in -D represent mean ± SEM of triplicate experiments. Data analyzed by One way ANOVA with Tukey's post-hoc test of significance. Results indicate level of significance. *p < 0.05. (E) Composite Western blot showing pattern of expression for NF-M, PSD-95, and SNAP-25. Representative western blots of one experiment showing patterns of expression in untransfected and different FtMt clones. Experiment represents the sequential probing of single membrane for NF-M, PSD-95, and SNAP-25 followed by normalization for β-actin.

