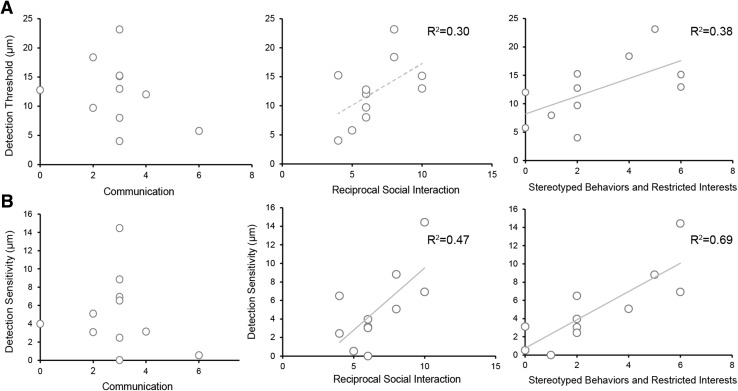
Fig. 4.
Relationship of the detection threshold (a) and detection sensitivity (b) with the severity of atypical behaviour as assessed by the Autism Diagnostic Observation Schedule, Second Edition (ADOS-2) in the ASD group for the 200-Hz condition. Solid lines indicate significant correlations and the dotted line indicates marginally significant correlation

