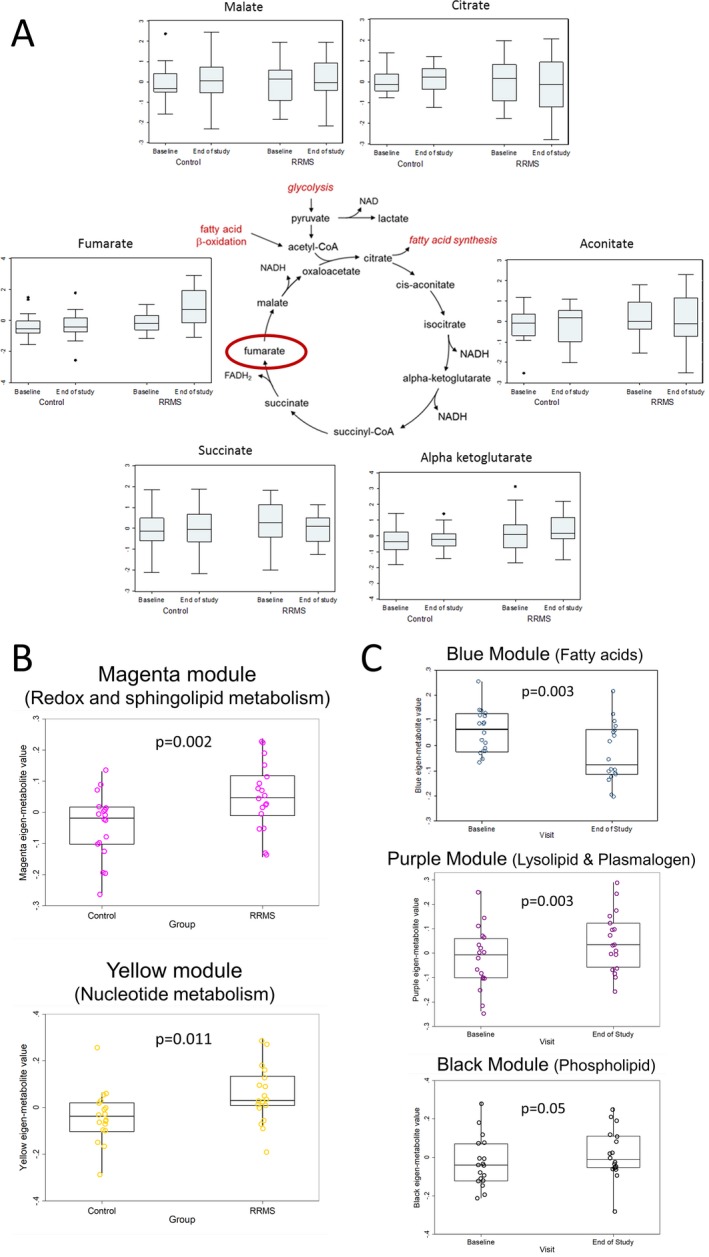
Figure 1.

Dimethyl fumarate treatment alters the metabolome of RRMS patients. (A) depicts the change in various tricarboxylic acid cycle metabolites from baseline to the end of the study in both the RRMS and healthy controls groups. (B) includes box plots of eigen‐metabolite values of metabolic modules that differed at baseline between RRMS and healthy control groups. The modules were compared between groups using linear regression and models were adjusted for age and sex. The contents of these modules are listed in Table 2 and Table S1. (C) includes box plots of eigen‐metabolite values of metabolite modules that changed significantly in the RRMS group with DMF treatment. Comparisons were made using generalized estimating equation models. The contents of these modules are listed in Table 3 and Table S2.
