Figure 3.

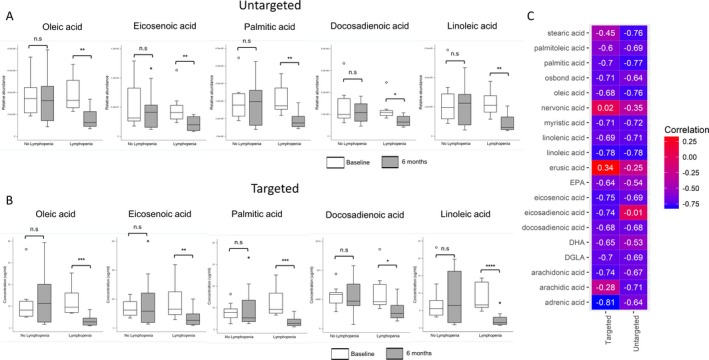
Changes in individual fatty acid levels measured by untargeted or targeted methods correlate with change in absolute lymphocyte counts. (A) shows box plots of various fatty acids (contained in the fatty acid (blue) metabolic module) measured at baseline and 6 months post‐DMF initiation, stratified by development of lymphopenia. (A) contains plots of values derived from the global untargeted metabolomics analysis, while (B) contains similar box plots of fatty acids measured as part of a targeted metabolomics panel to confirm findings noted in the global analysis. There were significant changes in fatty acid levels measured by targeted or untargeted analysis only in the lymphopenic subgroup. Baseline and 6 month values were compared using a paired t‐test. (C) shows a heat‐map of correlations between the change in individual fatty acid levels (targeted/untargeted) and the change in absolute lymphocyte counts. This demonstrates the overall concordance between values derived from the two analytical methods and the high correlation between change in individual fatty acid levels and the change in absolute lymphocyte counts with DMF treatment.
