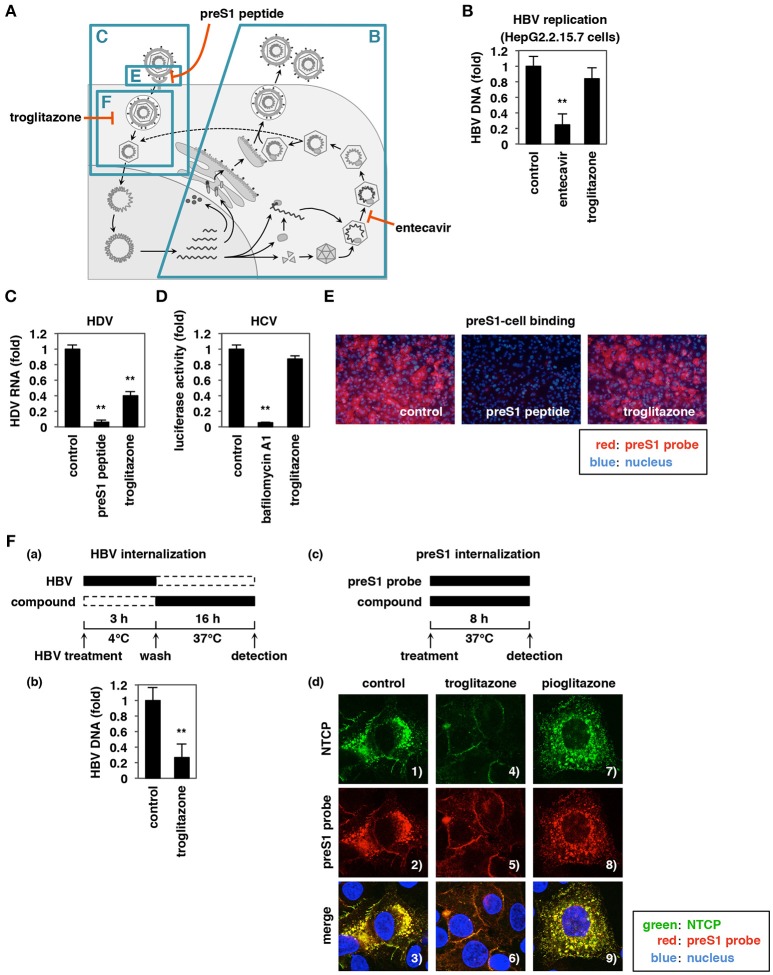
Figure 4.
Troglitazone inhibits HBV internalization. (A) Schematic representation of the HBV life cycle. The blue boxes show the life cycle processes that were examined in the experiments in (B,C,E,F). (B) HBV replication was evaluated by quantifying HBV DNA in HepG2.2.15.7 cells treated for 6 days with or without 1 μM entecavir (as a positive control) or 25 μM troglitazone. (C) HDV infection assay. HepG2-hNTCP-C4 cells were inoculated with HDV in the presence or absence of 100 nM preS1 peptide or 25 μM troglitazone, according to the protocol shown in Materials and Methods. HDV infection was evaluated by quantifying HDV RNA in the cells by real-time RT-PCR. (D) HCV infection was evaluated using the HCV pseudoparticle system, as described in Materials and Methods, following treatment with or without 10 nM bafilomycin A1 as a positive control or 25 μM troglitazone. (E) HBV preS1-mediated attachment to host cells was examined in HepG2-hNTCP-C4 cells exposed for 30 min at 37°C to TAMRA-labeled preS1 peptide (preS1 probe) in the presence or absence of 100 nM non-labeled preS1 peptide or 25 μM troglitazone. Red and blue signals indicate preS1 probe and the nucleus, respectively. (Fa) Schematic of the experimental protocol used for examining HBV internalization. HepG2-hNTCP-C4 cells were treated with HBV at 4°C for 3 h to allow HBV-cell attachment without internalization into the cells. After free HBV was washed out, the cells were cultured for 16 h at 37°C in the presence or absence of 25 μM troglitazone to allow viral internalization. The cells then were trypsinized and extensively washed to remove the cell surface HBV, and HBV DNA in the cells was quantified (b). (c) Schematic of the experimental protocol used for examining preS1 internalization. HepG2-hNTCP-C4 cells were exposed for 8 h at 37°C to preS1 probe (red) in the presence or absence of 25 μM troglitazone or pioglitazone, and then were stained for NTCP (green) and the nucleus (blue) by immunofluorescence analysis (d). Merged patterns are shown in the bottom panels. Data are shown as mean ± SD. Statistical significance was determined using a two-tailed non-paired Student's t-test (**P < 0.01).

