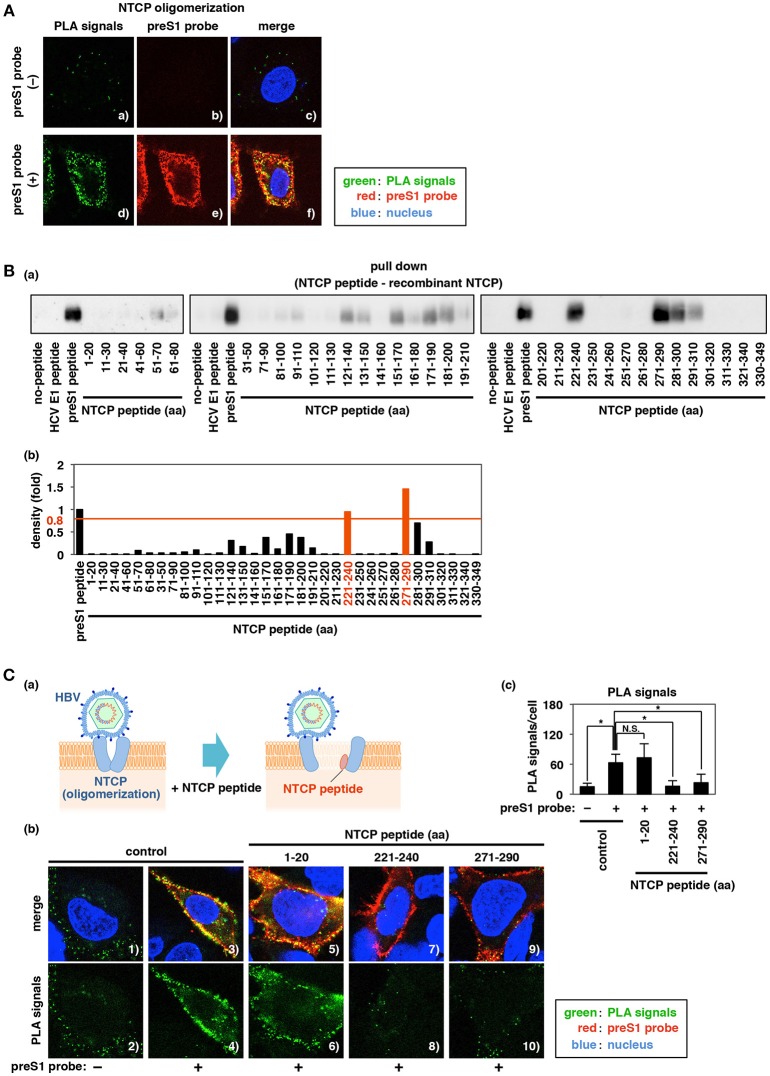
Figure 5.
Identification of peptides interacting with NTCP and impeding NTCP oligomerization. (A) Proximity ligation assay (PLA) to evaluate NTCP oligomerization. HepG2 cells overexpressing both myc-NTCP and HA-NTCP were treated for 30 min at 4°C with or without preS1 probe (red), and then the PLA signal (green) produced by the proximity of anti-myc and anti-HA antibodies was detected with Duolink PLA. The nucleus was also stained with DAPI (blue). Merged images of green, red, and blue signals are provided in the right panels. (B) Interaction between recombinant full-length His-tagged NTCP protein (His-NTCP) and the fragment peptides derived from NTCP, as examined by pull-down assay. Biotinylated peptides of HCV E1 (aa 111–140), preS1 (aa 2–48), or each of 34 NTCP fragments (20-aa lengths corresponding to the indicated regions) immobilized on streptavidin-agarose beads were incubated with His-NTCP. Co-immunoprecipitated His-NTCP was detected with anti-His antibody by immunoblot (a). Quantitative densitometry is shown in (b); values for the co-precipitated His-NTCP bands were normalized to that obtained with the preS1 peptide (defined as 1.0). (C) The effect of NTCP peptides (aa 1–20, aa 221–240, and aa 271–290) on NTCP oligomerization was observed using PLA, as shown in (A). PLA signal was detected in HepG2 cells overexpressing myc-NTCP and HA-NTCP following treatment with or without the indicated NTCP fragment peptides either in the presence (panels 3–10) or absence (panels 1–2) of preS1. (b) The lower panels show the PLA signal (green) only, and the upper panels show the merged images of green (PLA signal), red (preS1 probe), and blue (nucleus) signals. (c) PLA signals in the experiment in (b) were quantified using Dynamic Cell Count (KEYENCE). Data are shown as mean ± SD. Statistical significance was determined using a two-tailed non-paired Student's t-test (N.S.; not significant, *P < 0.05).

