FIGURE 2.

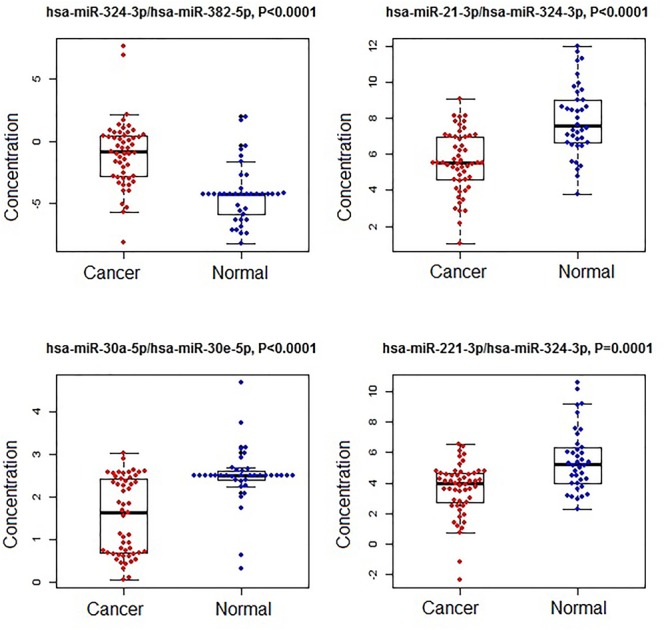
The concentrations of selected miRNA ratios between breast cancer and normal patients. The black horizontal bars are median values and the bottom and top box are the 25th and 75th percentiles. The p-values were reported by FDR.

The concentrations of selected miRNA ratios between breast cancer and normal patients. The black horizontal bars are median values and the bottom and top box are the 25th and 75th percentiles. The p-values were reported by FDR.