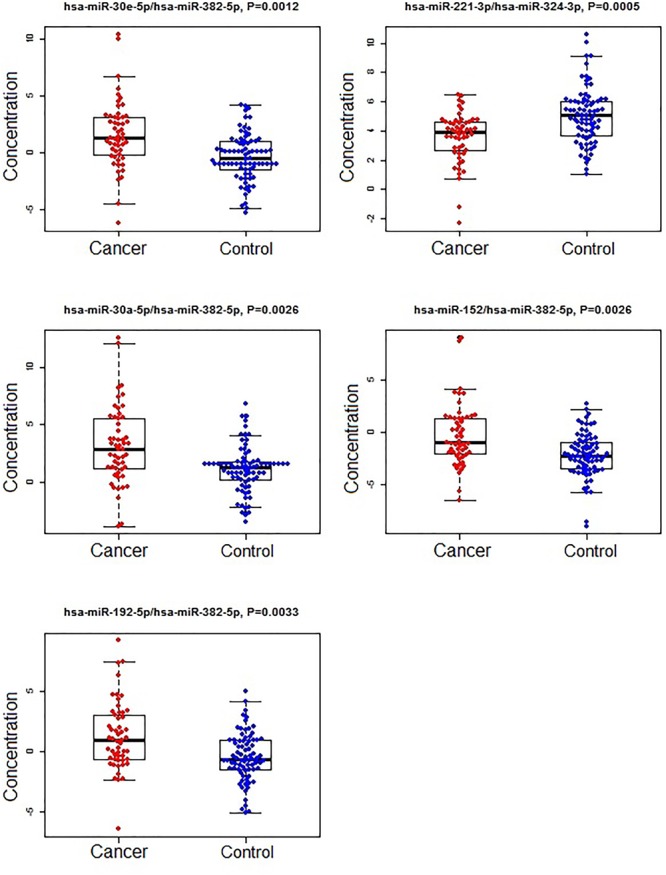
FIGURE 3.

The concentrations of selected miRNA ratios between breast cancer and non-cancer (control, including benign and normal) patients. The black horizontal bars are median values and the bottom and top box are the 25th and 75th percentiles. The p-values were reported by FDR.
