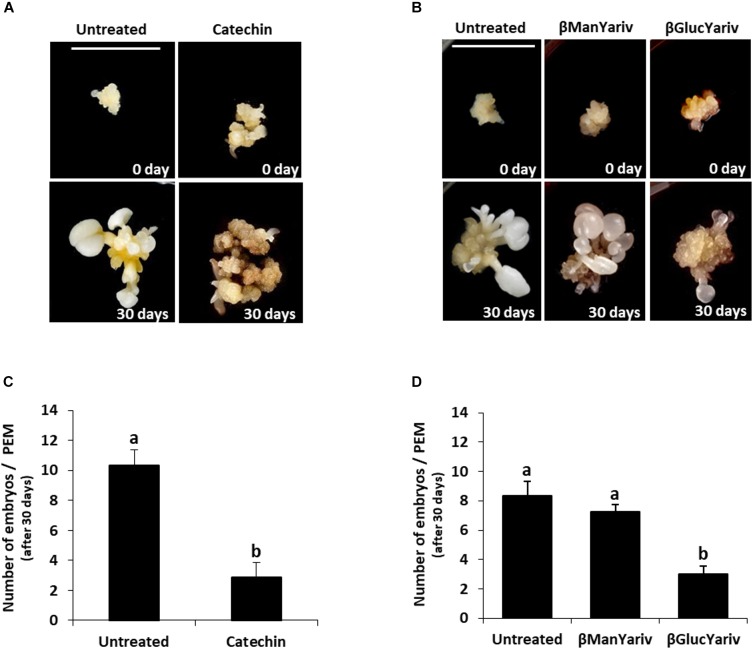
FIGURE 10.
Effects of inhibition of PME activity by catechin and blocking of AGPs by Yariv reagents on somatic embryogenesis. (A) Catechin treatment. Left pictures: Untreated culture at the beginning of the treatment, 0 day, showing representative proembryogenic masses (PEMs) with a few small embryos arising from them, and after 30 days, when numerous embryos at different stages have developed. Right pictures: Catechin-treated culture at the beginning of the treatment showing similar PEMs than those of untreated cultures, and after 30 days, showing high proliferation of new PEMs but almost no differentiated embryos. (B) Yariv reagent treatment. From left to right: Untreated culture, β-mannosyl-treated culture, which does not bind AGPs, and β-glucosyl-treated culture, which binds AGPs. All cultures at the beginning of the treatment (0 day) show clusters of PMEs and a few small embryos. After 30 days of treatment, untreated and β-mannosyl-treated cultures show numerous and well developed embryos at different stages and various sizes, while β-glucosyl-treated culture shows PEMs that have grown very little and only a very few embryos. Bars represent 1 cm, for all pictures. (C,D) Quantification of the embryo production in untreated cultures and cultures treated with catechin (C) and Yariv reagents (D). Columns represent mean values of the number of differentiated embryos per proembryogenic mass, after 30 days of treatment; bars represents the standard error of the mean (SEM). Different letters on columns indicate significant differences according to ANOVA and Tukey’s tests at p < 0.05.

