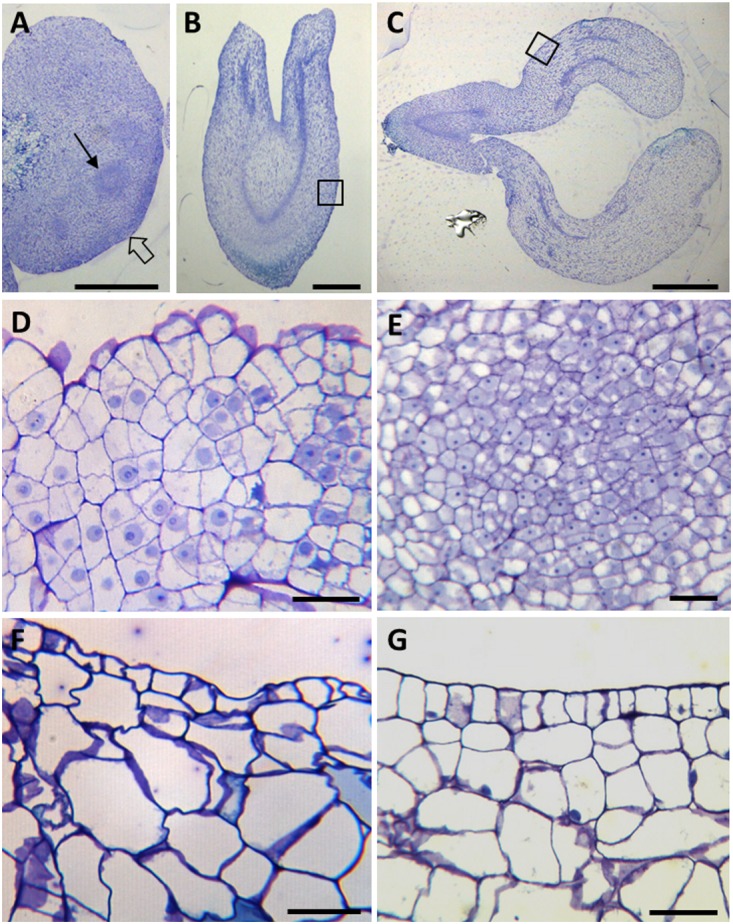
FIGURE 2.

Cellular organization of main stages of somatic embryogenesis. Micrographs of semithin sections stained by Toluidine blue. (A–C) Panoramic views of cluster of proembryogenic masses (A), torpedo embryo (B) and cotyledonary embryo (C). (D–G) Details at higher magnification of representative regions of (A–C), as indicated by arrows and squares. (D,E) PEMs showing clusters of embryogenic cells at the periphery (D), as indicated by thin arrow in (A), and inside (D), as indicated by open arrow in (A). (F) Torpedo embryo. (G) Cotyledonary embryo. Bars in (A,B): 0.5 mm, in (C): 1 mm, in (D,E): 20 μm.
