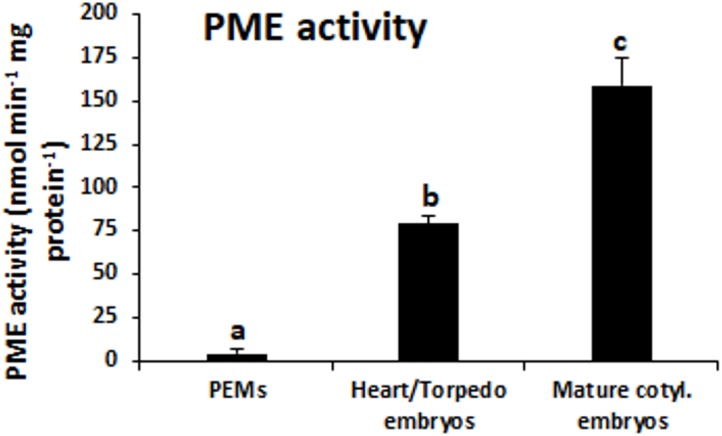
FIGURE 4.

PME activity during somatic embryogenesis. Histogram expresses enzymatic activity levels at three stages of somatic embryogenesis: proembryogenic masses (PEMs), heart-torpedo embryos and mature cotyledonary embryos. Columns represent mean values and bars indicate the standard error of the mean (SEM). Different letters on columns indicate significant differences according to ANOVA and Tukey’s tests at P < 0.05.
