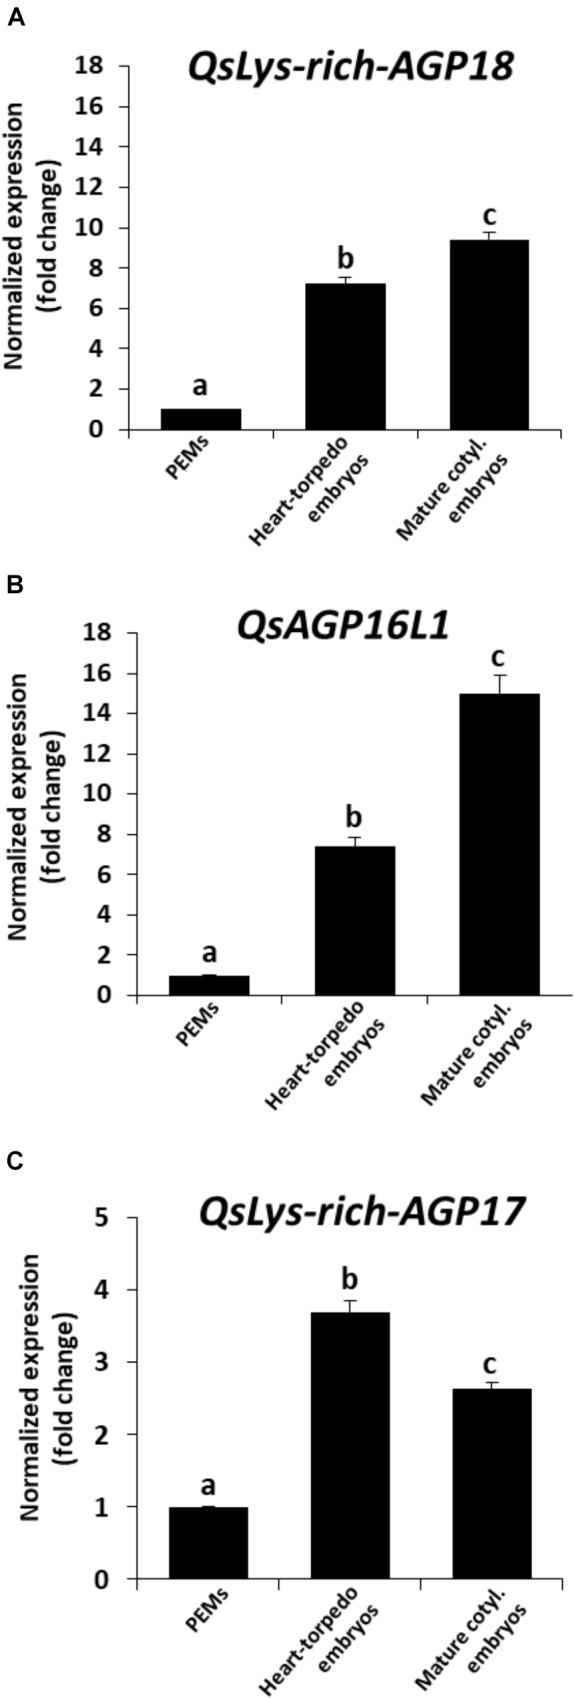
FIGURE 8.

Gene expression patterns of AGP genes during somatic embryogenesis by RT-qPCR. Histograms show relative changes of expression at three stages of somatic embryogenesis: proembryogenic masses (PEMs), heart-torpedo embryos, and mature cotyledonary embryos. (A) Temporal expression pattern of QsLys-rich-AGP18 gene. (B) Temporal expression pattern of QsAGP16L1 gene. (C) Temporal expression pattern of QsLys-rich-AGP17 gene. Each column represents the mean of at least three biological and three technical replicates. Transcript levels were normalized using QsACTIN values. Data were expressed as mean values of relative expression (fold-change values) to proembryogenic masses sample. Bars indicate the standard error of the mean (SEM). Different letters on columns indicate significant differences according to ANOVA and Tukey’s tests at P < 0.05.
