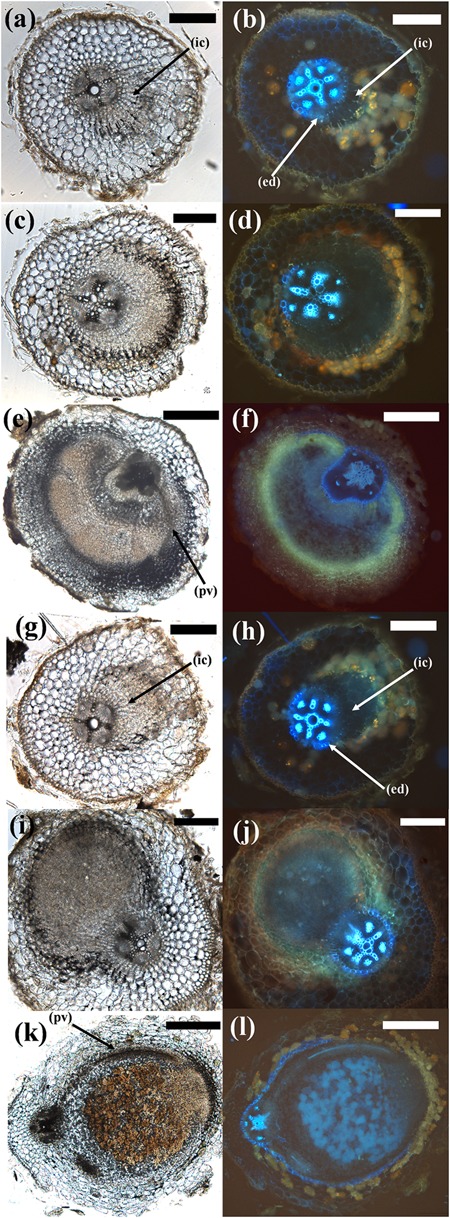
FIGURE 6.

Comparison of different stages of pseudonodule and nodule development in C. arietinum. (a–f) C. arietinum roots treated with 10 μM BAP; (g–l) C. arietinum inoculated with M. ciceri. Sections on the left show the brightfield images, photos on the right side show the respective images under UV exposure to visualize flavonoids (yellow–orange or blue autofluorescent cell content mainly in cortical cells surrounding nodules/primordia) and the endodermis (strongly blue auto-fluorescent cell walls). (a,b; 5d post-BAP) and (g,h; 5d post-inoculation) Early-stage primordia showing first cell divisions in the inner cortex (ic) which can be distinguished from the vascular tissue and the pericycle by the fluorescent endodermis (ed). (c,d; 7d post-BAP) and (i,j; 7d post-inoculation) Medium-stage primordia. Note the more clearly defined structure of the inoculated phenotype. (e,f; 14d post-BAP) Mature pseudonodule displaying peripheral vasculature (pv). (k,l; 14d post-inoculation) Mature nodule displaying peripheral vasculature (pv). Bars (a–d), (g,h) 200 μm; (e,f), (k,l) 500 μm.
