FIGURE 8.

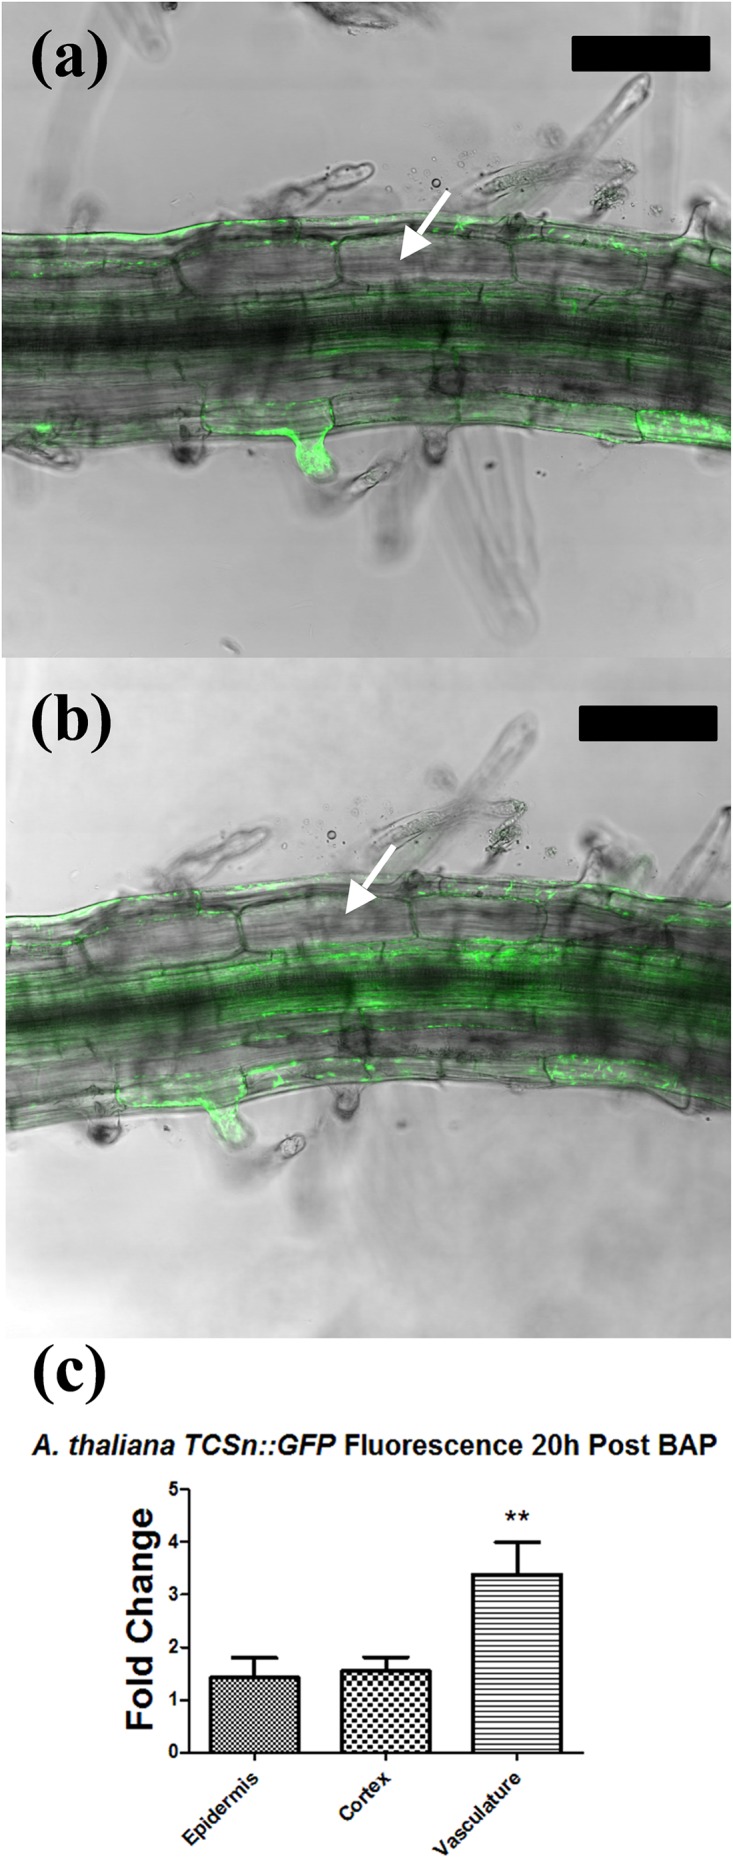
Tissue-specific response in Arabidopsis thaliana TCSn::GFP following cytokinin treatment. (a,b) Confocal laser scanning microscope images of A. thaliana TCSn::GFP root 1 cm behind the root tip. GFP fluorescence (green) is overlaid on the brightfield image. (a) Root before treatment. (b) Root after incubation in 1 μM BAP solution for 20 h. (c) Fold change increase in GFP fluorescence intensity in three different tissue types. Fold changes reflect the ratio of fluorescence intensity values before and after BAP treatment. Values were statistically compared using a two-tailed t-test. n = 6. ∗∗ indicates p < 0.01. White arrows, cortical cells. Bars, 100 μm.
