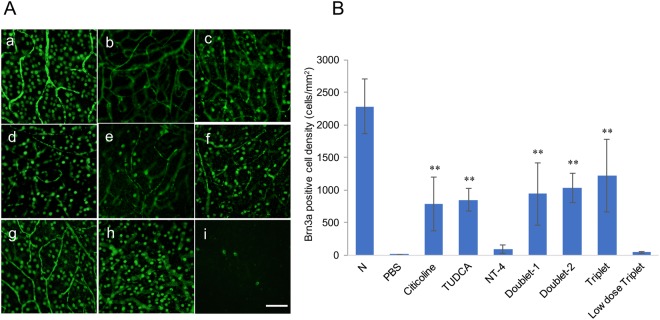
Figure 1.
(A) Representative photomicrographs of Brn3a immunopositive cells in the flat mount retina. (a) Normal, (b) PBS (ONC + PBS), (c) citicoline (ONC + citicoline), (d) TUDCA (ONC + TUDCA), (e) NT-4 (ONC + NT-4), (f) Doublet-1 (ONC + citicoline + TUDCA), (g) Doublet-2 (ONC + TUDCA + NT-4), (h) Triplet (ONC + citicoline + TUDCA + NT4). (i) Low dose Triplet (Scale Bar: 50 μm.) (B) Graph showing RGC count (cells/mm2) of each group two weeks after ONC. The densities of RGCs in all of the eyes except NT-4 group were significantly higher than those of RGCs without treatment. (**P < 0.001) Values represent means ± SEM of n = 6 animals per experimental group. Significances of intergroup differences were evaluated by one-way ANOVA with Tukey’s multiple comparisons test.

