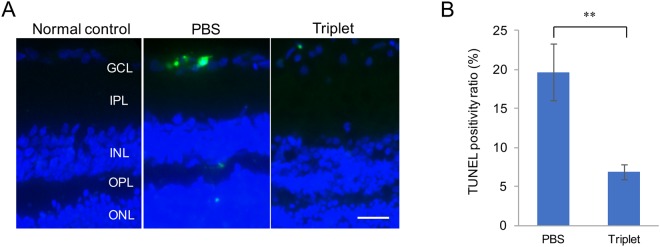
Figure 2.
(A) Representative photomicrographs of TUNEL positive cells in the ganglion cell layer (GCL) in normal control, PBS and Triplet-treated rats at 5 days after ONC. (Scale Bar: 20 μm) (B) Graph showing the ratio of TUNEL-positive to the total number of retinal neuronal cells in the GCL after ONC. Compared with the untreated PBS group, TUNEL positive ratio was decreased significantly in the Triplet eye drop treatment group (**P < 0.001). Values represent means ± SEM of n = 3 animals per experimental group.

