
Fig. 5.
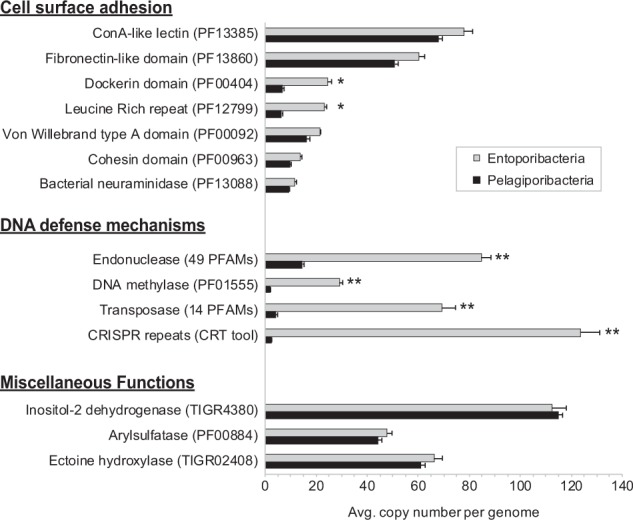
Highly over-represented gene families. Functional families shown averaged 10 or more copies per genome in either Entoporibacteria, Pelagiporibacteria, or both. Asterisks indicate statistically significant differences, as defined by two-tailed Student’s t-test. *p-values < 0.01, **p-values < 0.001