Fig. 2.
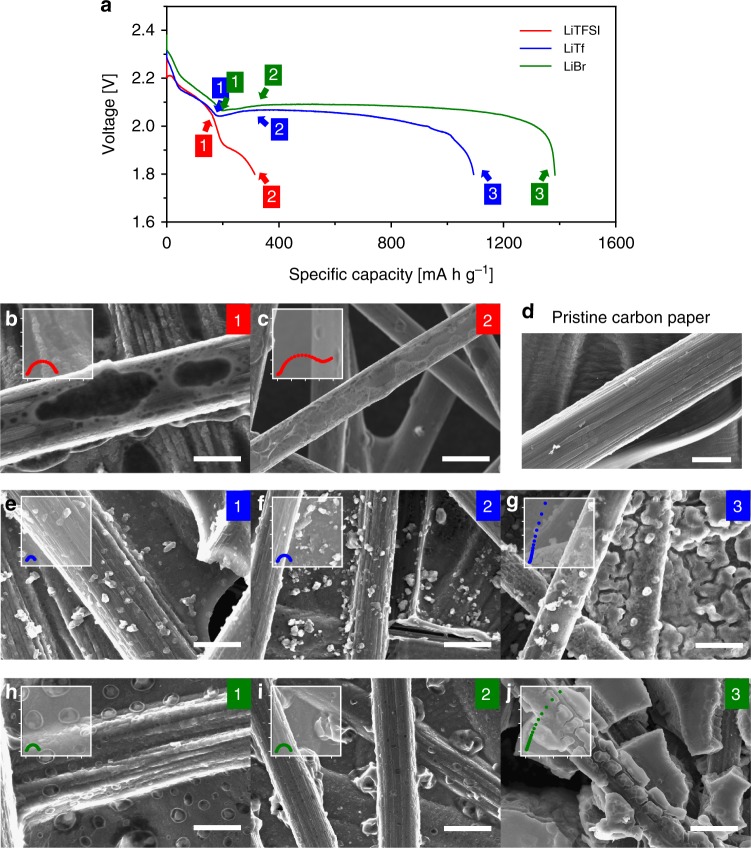
Morphological evolutions of lithium sulfide at different states of discharge. a The first discharge curves at 0.05 C. Discharge of the individual cells stopped at the marked states of discharge (SOD) for Scanning electron microscopy (SEM) analysis. d A SEM image of the pristine carbon paper (CP) electrode, SEM images of the CP electrodes at different SODs with the b, c lithium bistriflimide (LiTFSI), e–g lithium triflate (LiTf), and h–j lithium bromide (LiBr) electrolytes. Scale bars, 5 μm (b, d, e, h); 10 μm (c, f, g, i, j). The Nyquist plots of the impedances measured at the points are provided in the insets. (The range of the x and y-axes is from −100 to 1400 Ω cm2; enlarged figures are given in Supplementary Fig. 6.)

