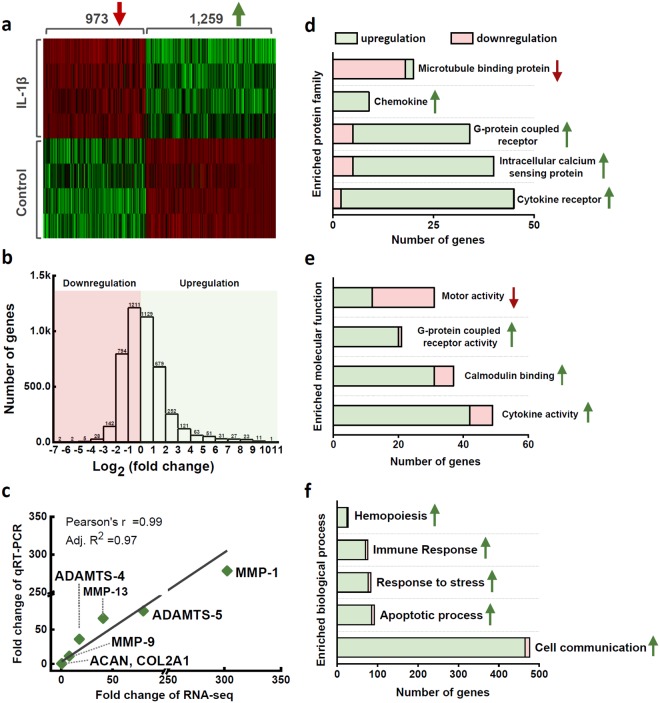
Figure 2.
Summary statistics of RNA sequencing data. (a) Unsupervised hierarchical clustering was performed for differentially expressed genes (absolute value of fold change >2 and FDR < 0.05) in the IL-1β treated cartilage explants. (b) Distribution of gene expression fold changes according to log2 transformation. (c) Validation of RNAseq results with qRT-PCR. Seven selected genes were tested and correlated with the Pearson’s correlation analysis. (d) Enrichment analysis of the protein family classification and Gene Ontology annotations in terms of (e) molecular functions and (f) biological processes.

