Figure 3.
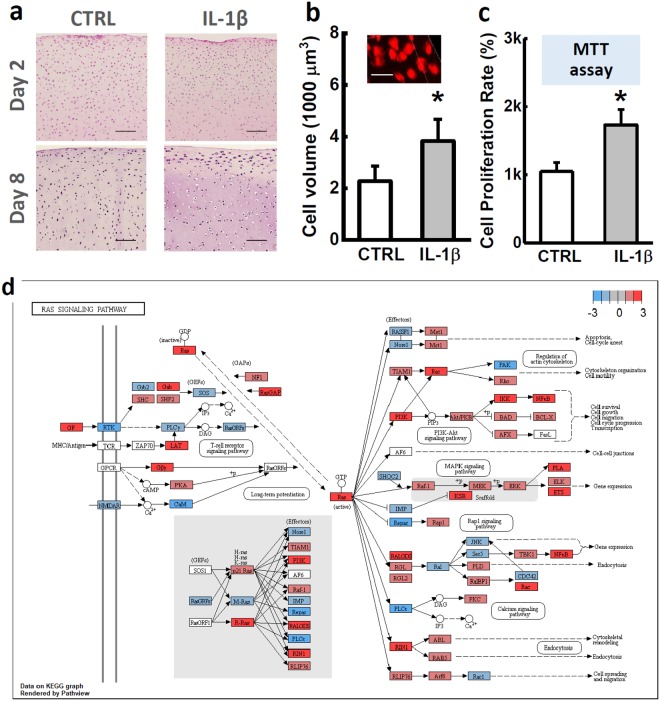
Chondrocyte swelling and proliferation. (a) H&E staining of cartilage explants after 2- and 8-day IL-1β treatment. Cell swelling, also termed as fattening, and proliferation can be observed after 8-day IL-1β culture. Scale bar = 200 µm. (b) Cell volume of chondrocytes in cartilage explants measured by 3D confocal imaging. Scale bar = 30 µm. (c) Cell proliferation rate determined by MTT assay. (d) Visualization of Ras superfamily signaling pathway regulated by IL-1β-treatment. Flowchart was plotted using RNAseq data in Pathview (version 3.6). Each node represented a gene, and the associated node color represented the expression changes in log2 ratios. For better readability, multiple genes with similar or redundant functional roles were pooled together as a single node. Absolute value of the maximum of expression changes of these genes was reflected by the node color. All data were shown as mean ± 95% confidence intervals. * vs control, p < 0.001 if otherwise marked.

