Figure 4.
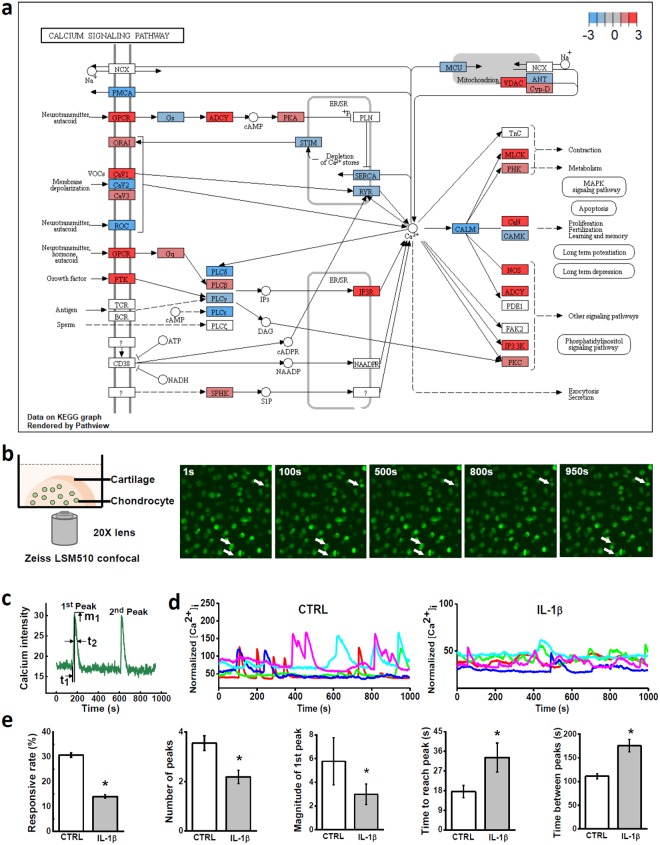
Calcium signaling of chondrocytes in cartilage explants. (a) Visualization of calcium signaling pathway regulated by IL-1β. (b) Illustration of calcium signaling. Half cartilage explant was dyed with fluorescent indicator and imaged on a confocal microscope for 15 minutes. Due to the fluctuation of [Ca2+]i concentration, image intensity of chondrocyte oscillates in recorded video (see supplementary material for calcium signaling video). (c) Definition of spatiotemporal parameters of [Ca2+]i peaks. (d) Representative [Ca2+]i curves of in situ chondrocytes from the control group and IL-1β treated group. (e) Parameters of [Ca2+]i peaks, including the average number of [Ca2+]i peaks, magnitude of peaks, time to reach a peak, and time between neighboring peaks. All data were shown as mean ± 95% confidence intervals. * vs control, p < 0.05 if otherwise marked.

