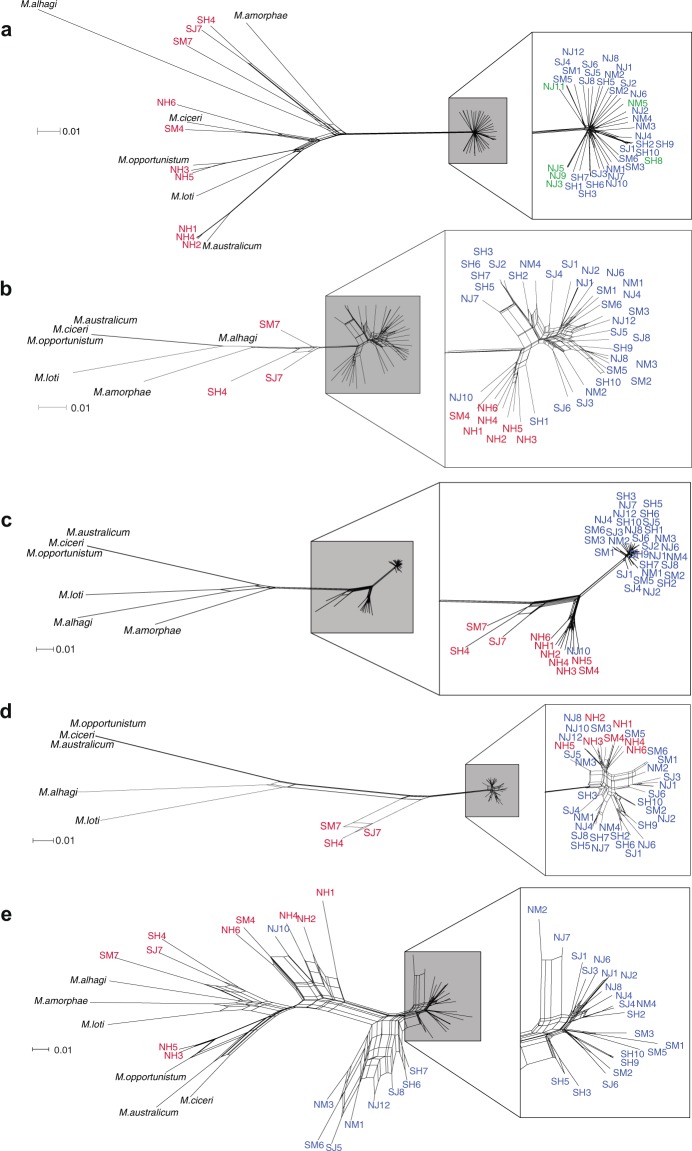
Fig. 6.
Neighbor networks highlight differences in relatedness patterns between strains based on genomic sequence and several symbiosis island gene clusters. Networks for (a) 100 random core single-copy genomic genes, and for the following near-core symbiosis island gene clusters: (b) cluster 9 (12 genes), (c) cluster 12 (32 genes), (d) cluster 15 (6 genes), and (e) cluster 20 (18 genes). Strain coloration: blue, focal_SI+ wild Mesorhizobium population; green, focal_SI− wild Mesorhizobium population (a only); red, sympatric non-focal_SI+ population strains; black, publicly available Mesorhizobium outgroups

