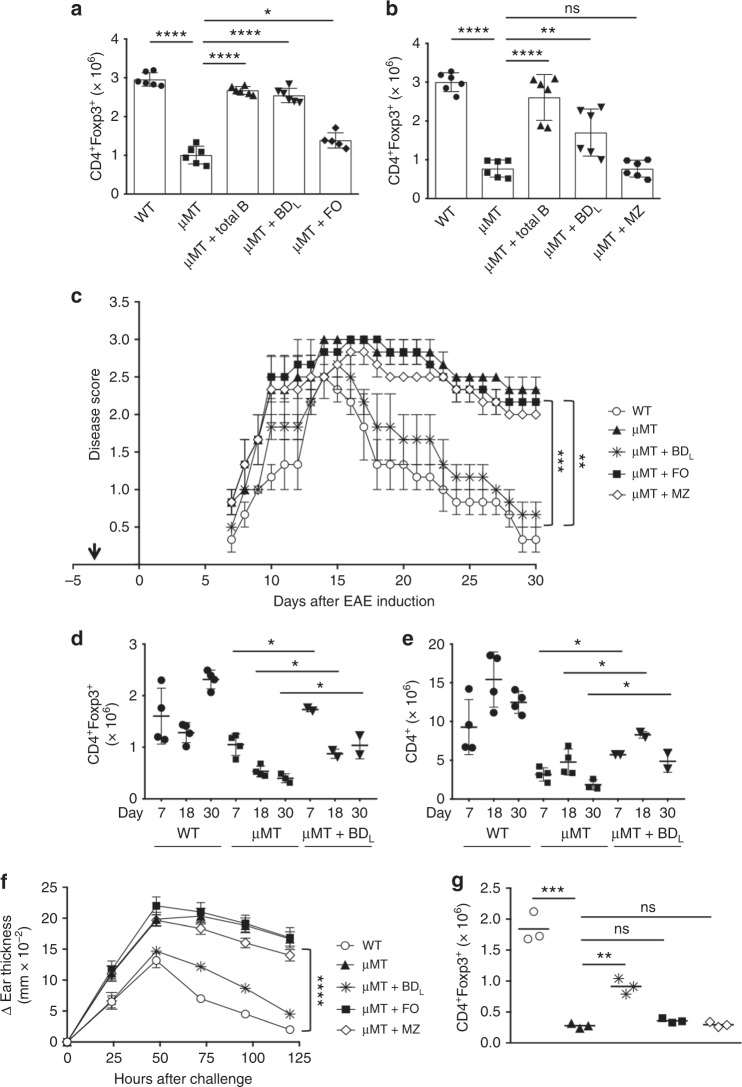
Fig. 3.
Splenic BDL exhibit regulatory activity while FO and MZ B cells do not. a, b B10.PLμMT (μMT) mice were treated with PBS or reconstituted with 10 × 106 FACS-purified splenic total (B220+) or 5 x 10⁶ BDL (a, b), FO (a), or MZ (b) B cells from anti-CD20 IgG1-treated mice and the absolute number of splenic Treg was determined by flow cytometry 10 days later. B10.PL (WT) mice received PBS. Pooled data from two independent experiments are shown. Individual data points (mice) are shown superimposed upon the mean ± SEM. a *p < 0.05, μMT vs. FO; ****p < 0.0001, WT vs. μMT, μMT vs. Total B and μMT vs. BDL. b **p < 0.01, μMT vs. BDL; ****p < 0.0001, WT vs. μMT and μMT vs. Total B. ns = not significant. c–e B10.PL (WT) or B10.PLμMT (μMT) mice were sublethally irradiated and 5 × 10⁶ BDL, FO, or MZ B cells were adoptively transferred into B10.PLμMT mice (arrow) and 3 days later EAE was induced as for Fig. 1e. c EAE scores were assessed daily. The data shown are the mean ± SEM daily disease score of three mice from one representative experiment of three. **p < 0.01, WT vs. μMT, WT vs. FO, μMT vs. BDL, and μMT vs. Total B; ***p < 0.001, WT vs. MZ for the day 30 timepoint. d, e The absolute number of Treg (CD4+Foxp3+, d) and conventional CD4 T cells (CD4+Foxp3−, e) was determined in the spleen by flow cytometry on days 7, 18, and 30 following EAE induction. n = 2–4. *p < 0.05. f, g CHS was induced in C57BL/6 WT or μMT mice treated with PBS or μMT mice that had received 5 × 10⁶ BDL, FO, or MZ B cells by painting one ear with 3% oxazolone on days 0 and 6. f Ear thickness was measured every 24 h for 6 days. Data shown are the mean change in ear thickness ± SEM from time 0 measured just prior to the second treatment. n = 6. ****p < 0.0001, WT vs. μMT, MZ and FO WT and μMT vs. μMT + BDL for the 120 h timepoint. g CD4+Foxp3+ Treg were quantitated in the spleen at 120 h. **p < 0.01, μMT vs. μMT + BDL; ***p < 0.0001, WT vs. μMT for the 120 h timepoint. n = 3 mice. ns = not significant. Statistical significance was determined using the unpaired t test

