Fig. 4.
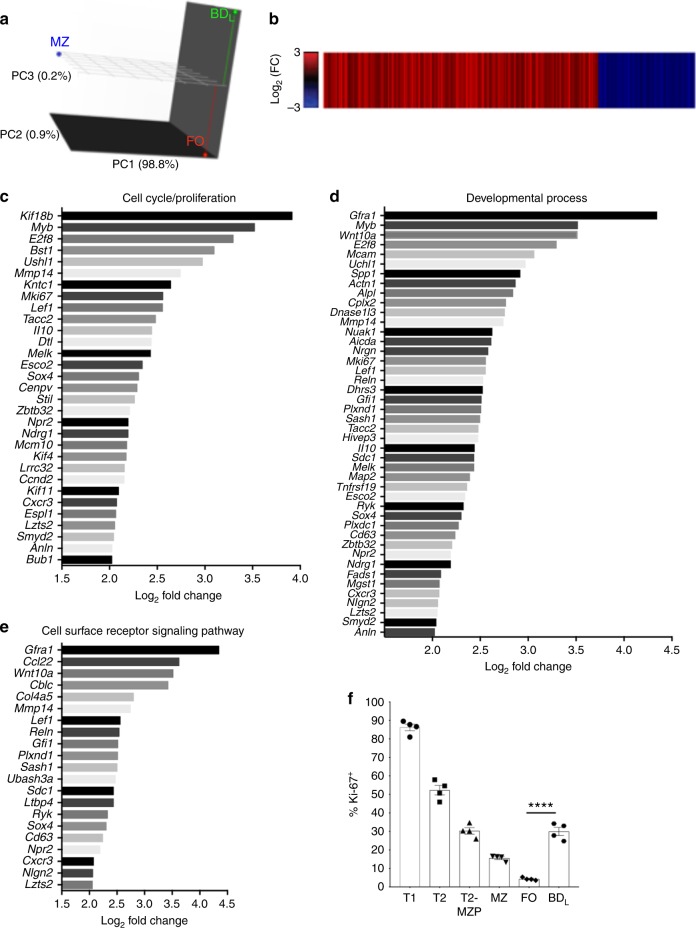
BDL undergo a high rate of proliferation. RNA-seq analysis was performed on FACS purified splenic BDL, FO, and MZ B cells from B10.PL mice. a PC analysis was performed on the log2-transformed FPKM, with the % variance encompassed within each PC shown. The distribution of BDL (green), FO (red), and MZ (blue) B cells within the 3D plot are shown. b A heat map displaying the log2 fold change for genes that showed a significant difference (Benjami–Hochberg adjusted p < 0.05) between BDL and FO B cells are shown. Red bars show genes more highly expressed and blue reduced expression in BDL . n = 3. c–e Barplots of the most highly differentially expressed genes (log2 fold change >2) in BDL compared to FO cells within the select Gene Ontology terms cell cycle/proliferation (c), developmental process (d), and cell surface signaling pathway (e) are shown. f The percentage of splenic T1 (B220+IgMhiCD21lowCD23−CD93+), T2, T2-MZP (B220+IgMhiCD21hiCD23+), MZ, BDL and FO B cells from C57BL/6J mice expressing Ki-67 was determined by flow cytometry. f Individual data points (mice) are shown superimposed upon the mean ± SEM from one independent experiment of two. ****p < 0.0001. Statistical significance was determined using the unpaired t test

