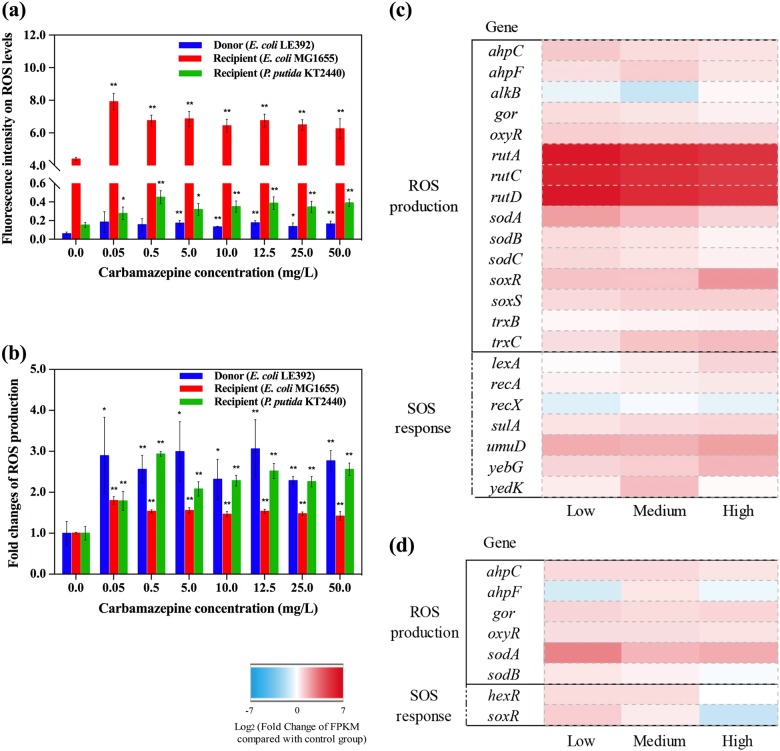
Fig. 2.
Effects of carbamazepine on ROS generation and SOS response in the donor (E. coli K-12 LE392) and recipient bacterial strains (E. coli MG1655 and P. putida KT2440). a Fluorescence intensity relating to ROS levels. b Fold changes of ROS production. c Fold changes of expression of core genes related to ROS production and SOS response in donor bacteria. d Fold changes of expression of core genes related to ROS production and SOS response in recipient bacteria. Significant differences between carbamazepine-dosed samples and the control were detected using independent-sample t test, P values were corrected by the “Benjamini–Hochberg” method as Padj, *Padj < 0.05, and **Padj < 0.01. Low, medium, and high in X-axis refer to 0.05, 10.0, and 50.0 mg/L carbamazepine, respectively

