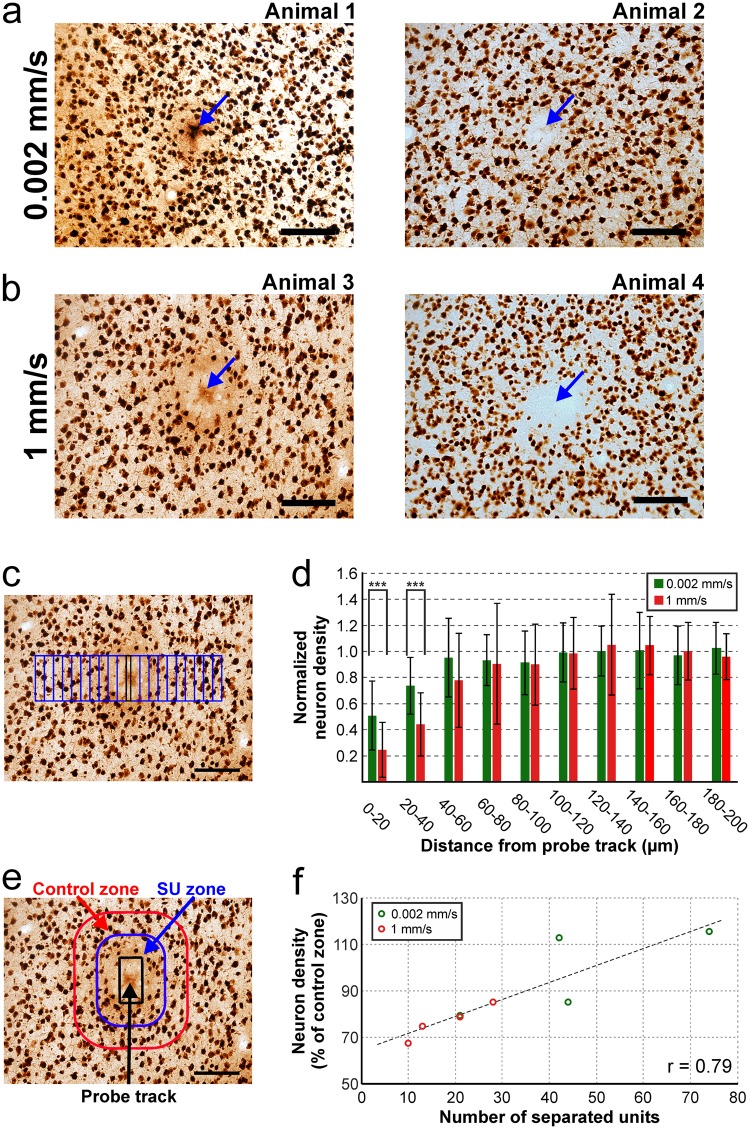
Figure 10.
Insertion speed-dependent difference in the neuronal cell loss around the probe track. (a,b) Representative NeuN-stained horizontal brain sections showing the probe track (blue arrow) and nearby neurons (small dark patches) after penetrations done either with the slowest (a) or with the fastest (b) insertion speed. Brain sections from two animals are shown for each speed. 20-fold magnification. Scale bars = 100 µm. (c) Neuron numbers were automatically counted in twenty bins (blue rectangles having an area of 20 × 100 µm2) on each side of the probe track (black rectangle in the center; area: 10 × 100 µm2). Only ten bins are shown on each side. Scale bar = 100 µm. (d) Normalized neuron density in the first ten 20-µm-wide bin located closest to the probe track for each insertion speed after automatic image analysis. Average and standard deviation is presented. Normalized neuron densities were averaged across penetrations and sides. ***p < 0.001; Student’s t-test. (e) To complement the results of the automatic cell counting, neuron numbers were manually counted in two zones around the probe track (black rectangle). The single unit (SU) zone was located 0–50 µm from the probe track (blue rounded rectangle), while the control zone was 50–100 µm away from the track (red rounded rectangle). Scale bar = 100 µm. Neuron density measured in the SU zone was normalized to the neuron density in the control zone. (f) Scatter plot showing a strong correlation between the single unit yield and the normalized neuron density in the SU zone.

