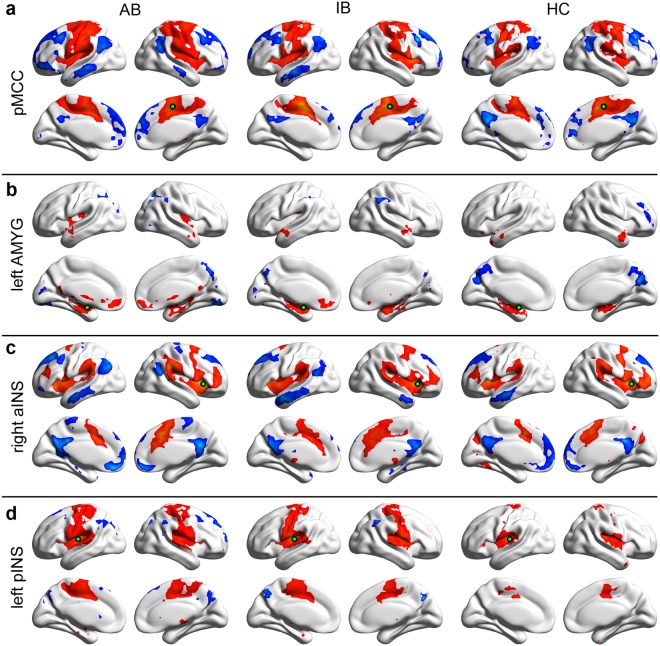
Figure 1.
Positive and negative functional connectivity maps seeded from pMCC (a), left AMYG (b), right aINS (c) and left pINS (d) for advanced batters (AB), intermediate batters (IB) and healthy controls (HC) (pMCC, posterior midcingulate cortex; AMYG, amygdala; aINS, anterior insular cortex; pINS, posterior insular cortex; each seed was a 6 mm radius sphere shown in green; red and blue colour indicate positive and negative connectivity maps, respectively, with an AlphaSim correction threshold of p < 0.01).

