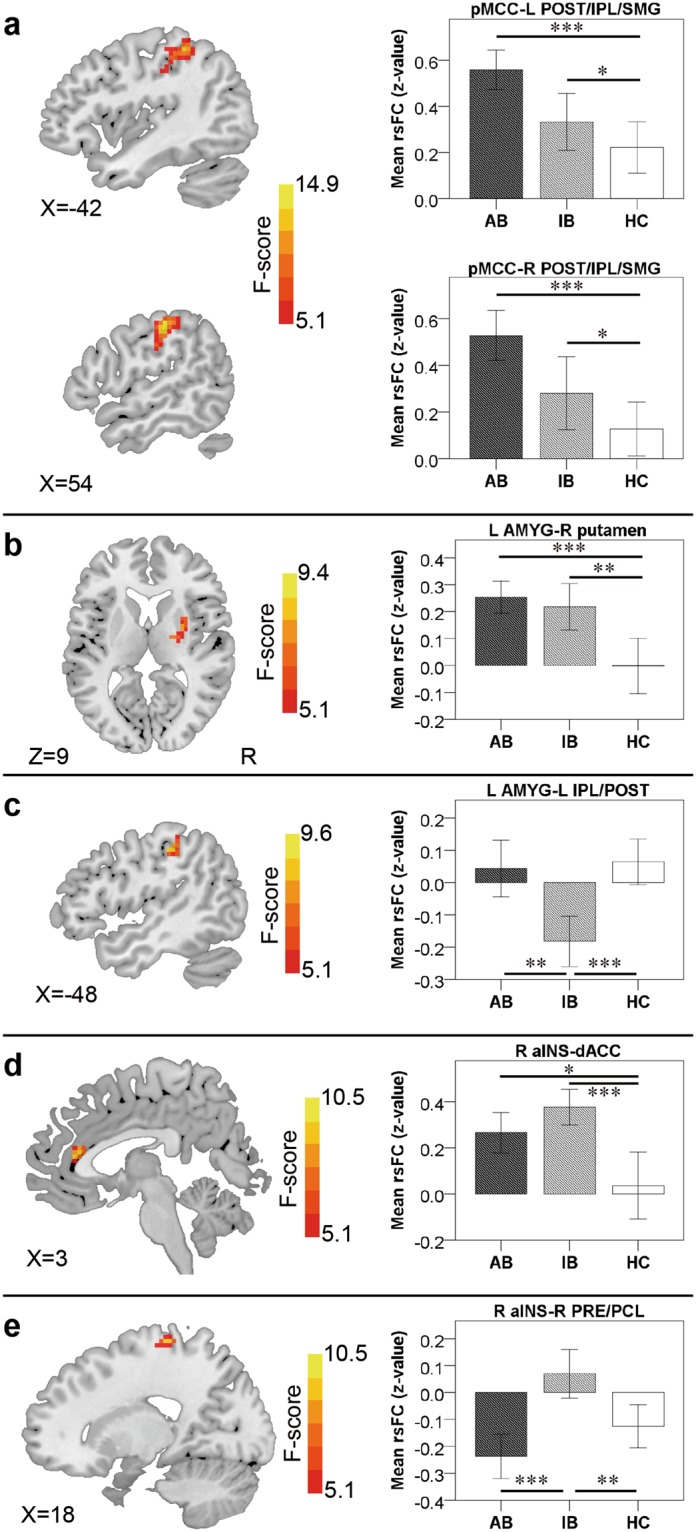
Figure 2.

Regions showing group differences identified through ANCOVA (with an AlphaSim correction threshold of p < 0.01) and post-hoc comparisons in the pMCC(+) (a), left AMYG(+) (b), left AMYG(−) (c), right aINS(+) (d) and right aINS(−) networks (e), each with the corresponding mean strength between the seed and region for advanced batters (AB), intermediate batters (IB) and healthy controls (HC) shown in the bar plot, error bars indicate two standard errors, and asterisks indicate significant differences with Bonferroni correction (*p < 0.05, **p < 0.01, ***p < 0.001; pMCC, posterior midcingulate cortex; AMYG, amygdala; aINS, anterior insular cortex; pINS, posterior insular cortex; POST, postcentral gyrus; IPL, inferior parietal lobule; SMG, supramarginal gyrus; dACC, dorsal anterior cingulate cortex; PRE, precentral gyrus; PCL, paracentral lobule; L, left; R, right).
