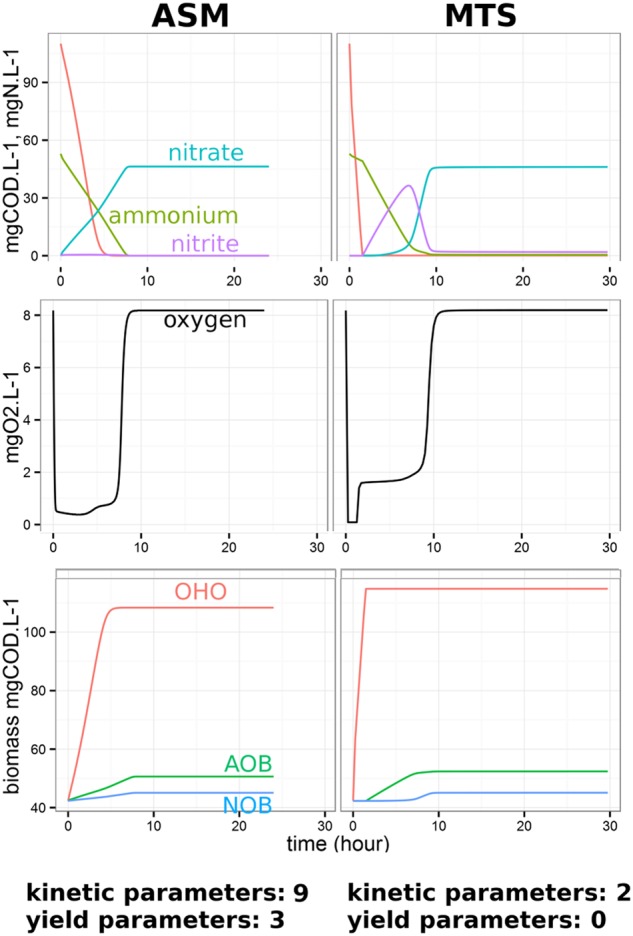
Fig. 3.

Concentration of main chemical species and biomass over time for a simplified activated sludge community in an aerated batch reactor. Left column shows the prediction from ASM; right column shows the predictions from the MTS model. The units used to express the concentration of the chemical species are the same as in the ASM models
