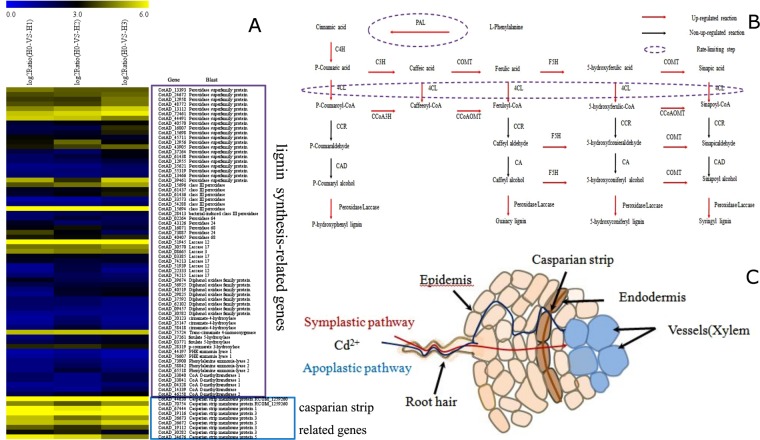
Figure 4.
The physical barrier strategy for cadmium tolerance in cotton. (A) A heat map illustrating the differential expression of genes related to the formation of a physical barrier under Cd stress. x axis is log2x value of relative expression level. (B) Lignin biosynthetic pathway genes differentially expressed under cadmium stress. (C) A schematic diagram of the obstruction of cadmium ion transport by the Casparian strip in cotton roots.

