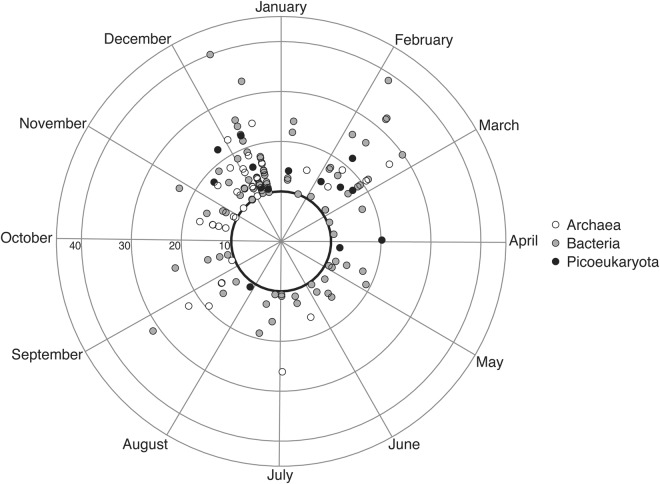
Fig. 3.
Polar plot showing when during the year the rhythmic ASVs reoccur and the strength of reoccurrence (PNmax, calculated via the LSP). The black circle shows the statistical threshold for significant rhythmicity (PNmax = 10). The ASVs are color coded according to which domain of life they belong to

